
Shengyang Wu, Benli Yu, Lei Zhang. Mutual aid instead of mutual restraint: interactive probing for topological charge and phase of a vortex beam of large aberrations[J]. Photonics Research, 2024, 12(1): 172
- Photonics Research
- Vol. 12, Issue 1, 172 (2024)
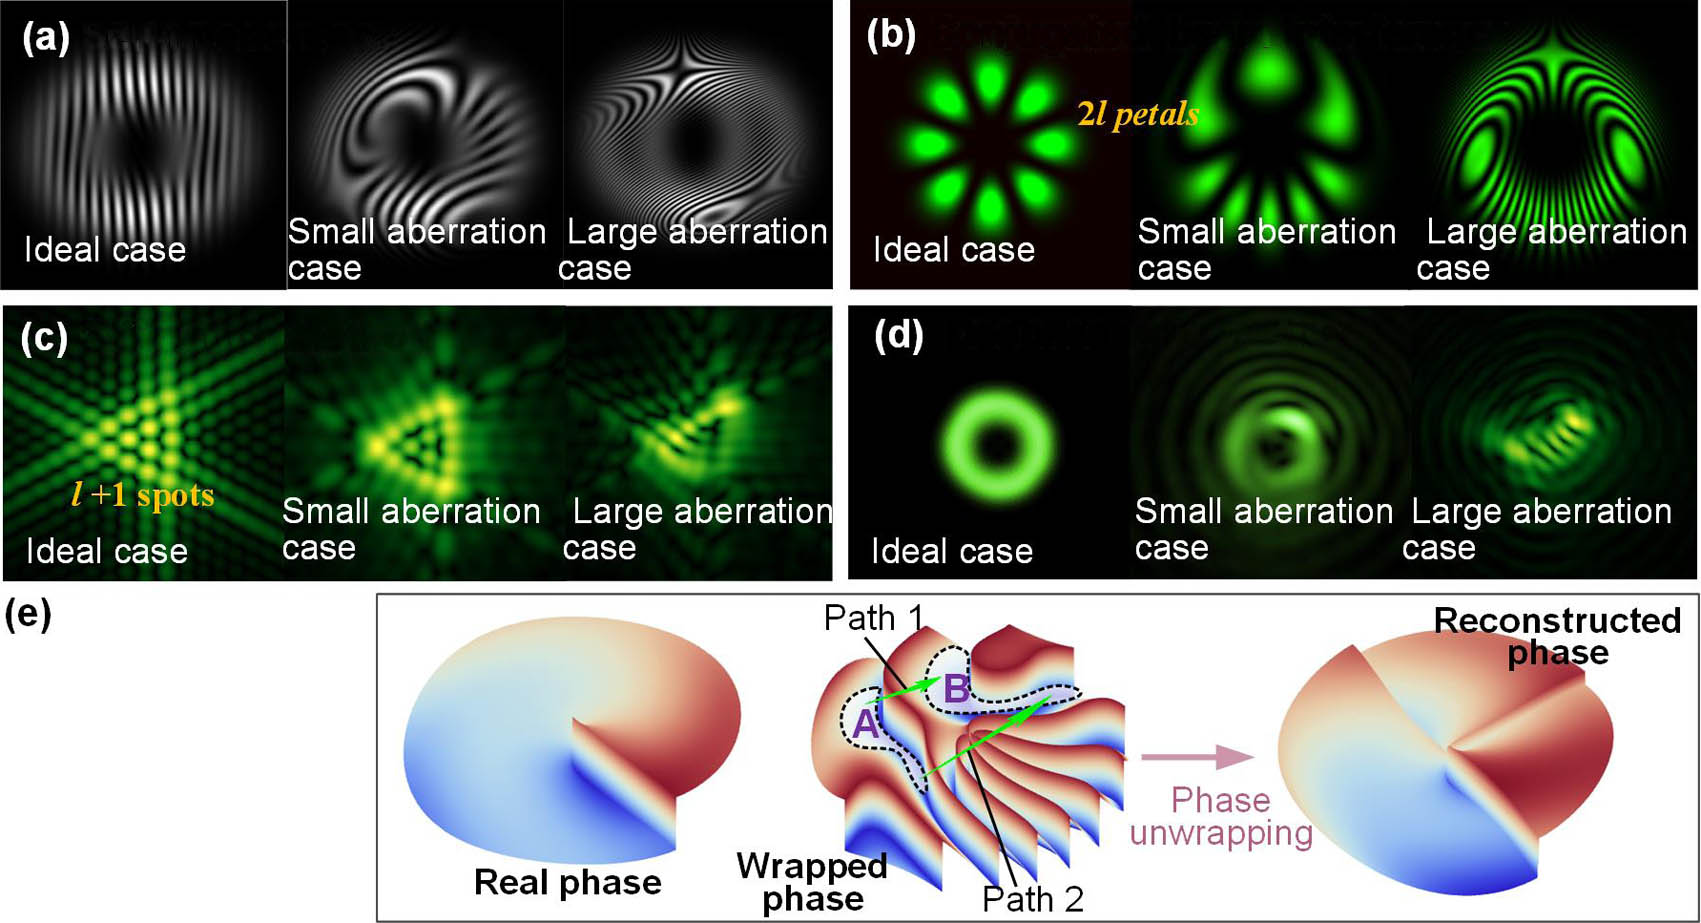
Fig. 1. Mutual restraining of TC determination and phase recovery in a vortex beam of aberrations, in which (a)–(d) are the effect of aberrations on TC measurements while (e) is the effect of TC on the aberration phase measurement. (a) Bifurcations of self-interference fringes, (b) conjugated vortex beam interference patterns, (c) triangular aperture diffraction patterns, (d) hollow intensity image from which TC is determined by deep learning, (e) phase unwrapping dilemma due to the phase jump aliasing in the vortex phase.
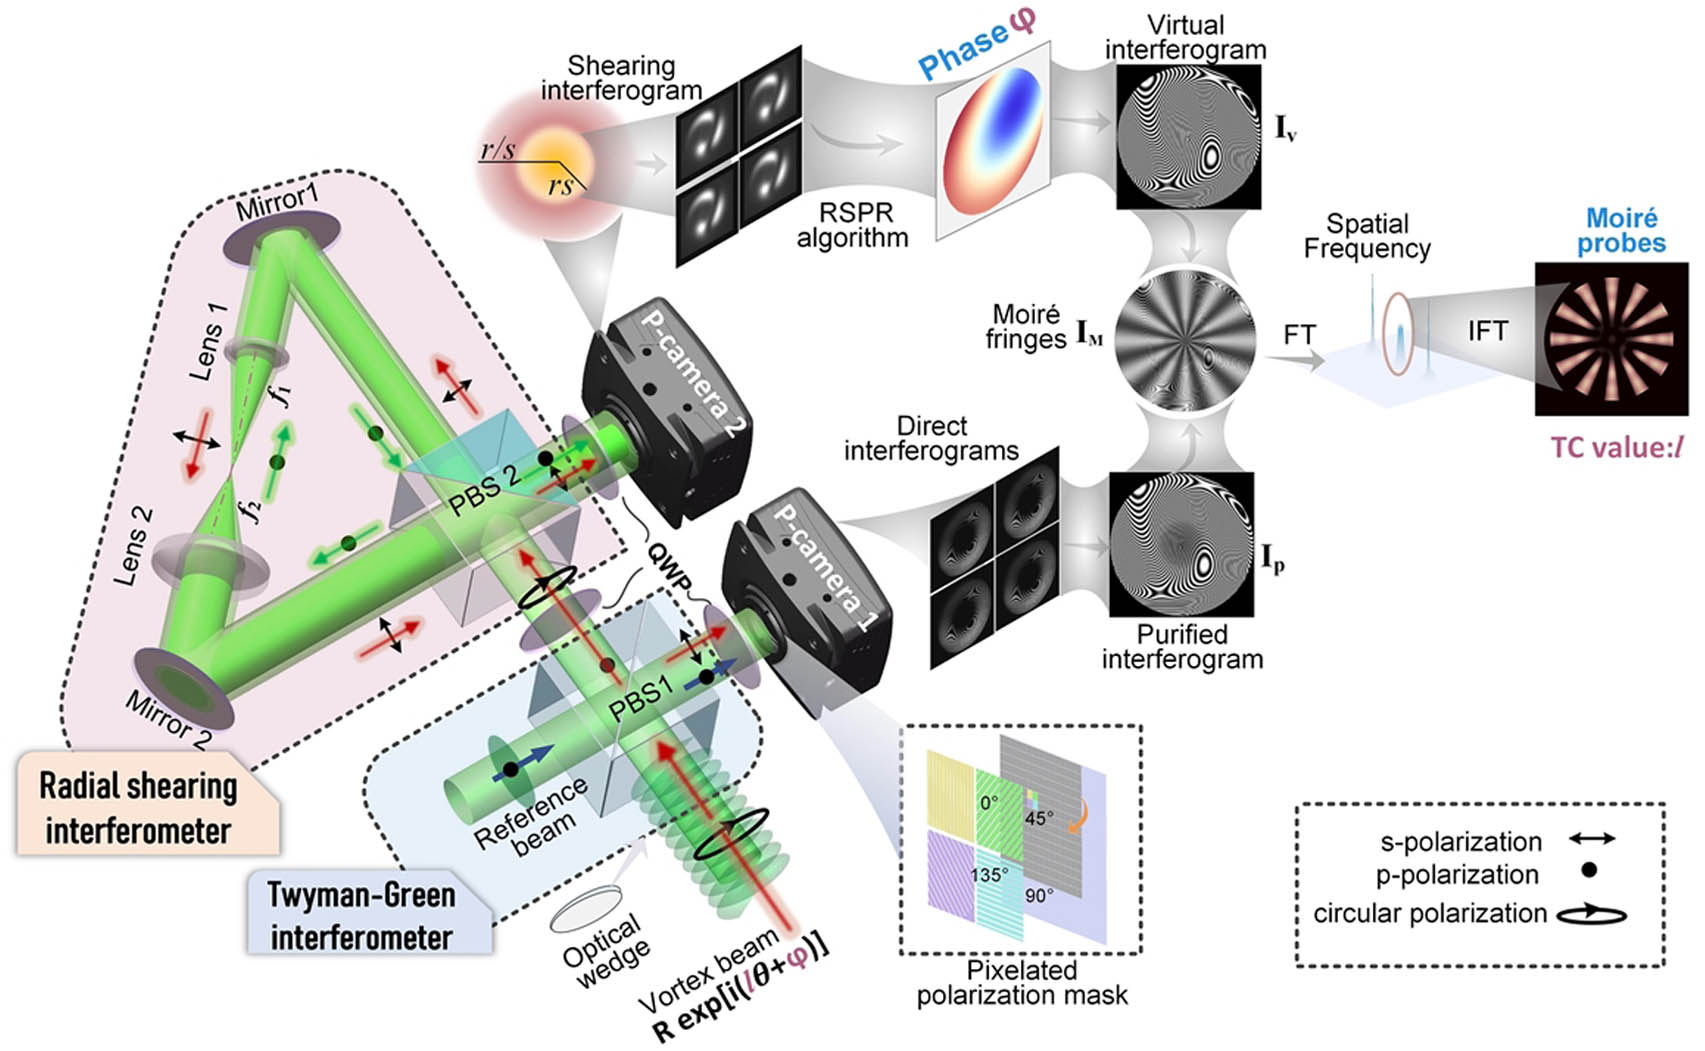
Fig. 2. Principle of the interactive probing method. The system consists of a Twyman–Green interferometer and an annular radial shearing interferometer. The two interferometers capture the purified interferogram and radial shearing interferogram, respectively. The RCP and LCP beams before the P-cameras in the two interferometers are designed to meet the synchronous phase shift condition. The aberration phase extracted from the shearing interferogram is used to generate a virtual interferogram. The Moiré probes then can be extracted from the product of the purified interferogram and virtual interferogram.
Fig. 3. Phase recovery and TC determination results with increasing incident aberrations. (a) Incident vortex phases with aberrations, (b) direct interferograms with the carrier, (c) shearing interferograms, (d) recovered phases and recovered errors, (e) Moiré probes, (f) far-field spots, (g) triangular aperture diffraction spots, (h) conjugated interference petals.
Fig. 4. Simulation results of TC determination and phase recovery in the case of | l | = 1 , 5 , 10 , 20 φ + l θ I p I s φ I v I M φ + l θ
Fig. 5. Sign determination of TC. These pictures are the keyframes of Visualization 3 showing the obvious rotation.
Fig. 6. Determination of the fractional TC with a camera of one megapixel. (a) Probes with TC between 6 and 7 spaced 0.1 apart, (b) GS curves which indicate the split process of corresponding TC probes. (c) Δ α l
Fig. 7. TC resolution analysis with a one-megapixel camera. (a) TC resolution variations with the increasing TC number, (b) error performance of TC determination in the cases of l = 3 – 4 , 10 – 11 , 20 – 21
Fig. 8. Simulation of TC determination and phase recovery in the case of misalignment and phase recovery error. (a) Incident vortex phases with exocentric singularity, (b) purified interferogram, (c) shearing interferogram, (d) recovered phase referring to aberrations, (e) virtual interferograms, (f) Moiré fringes, (g) Moiré probes, (h) TC determination error due to 1% phase recovery error in the cases of different beam aberrations and TC.
Fig. 9. Verification experimental setup.
Fig. 10. Comparative experiment results with different aberrations in different methods. Each set of three images corresponds to the cases of three different aberrations. (a) Triangular aperture diffraction spots, (b) far-field spots, (c) conjugated interference petals, (d) Moiré probes.
Fig. 11. Experiment results of TC determination and phase recovery in the case of l = 2 , 6 , − 10 , 15
Fig. 12. Determination results of the TC number from 3.1 to 4 with 0.1 space.
|
Table 1. Determination Results of the Fractional Part of Topological Charge with a Camera of One Megapixel
| |||||||||||||||||||||||||||||||||||||||||||||||||||||||||
Table 2. Experiment Results of Phase Recovery and TC Determination
|
Table 3. Experiment Results of Fractional TC Determination

Set citation alerts for the article
Please enter your email address
© Copyright 2018-2021 | Chinese Laser Press. All Rights Reserved 沪ICP备15018463号-20