Shengyang Wu, Benli Yu, Lei Zhang, "Mutual aid instead of mutual restraint: interactive probing for topological charge and phase of a vortex beam of large aberrations," Photonics Res. 12, 172 (2024)
Copy Citation Text
【AIGC One Sentence Reading】:An interactive probing method is introduced to accurately measure the aberrated phase and orbital angular momentum of vortex beams in non-ideal conditions, overcoming mutual restrictions and improving measurement effectiveness.
【AIGC Short Abstract】:This study presents an interactive probing technique for accurate measurements of aberrated phase and orbital angular momentum in vortex beams, overcoming mutual restrictions posed by traditional methods. By combining annular shearing interference and Moiré techniques, the method effectively unwraps the phase and determines the topological charge, respectively. Simulation and experimental results validate its efficacy, highlighting its significance in characterizing vortex beams in non-ideal environments and optical systems.
Note: This section is automatically generated by AI . The website and platform operators shall not be liable for any commercial or legal consequences arising from your use of AI generated content on this website. Please be aware of this.
Abstract
An imperfect propagation environment or optical system would introduce wavefront aberrations to vortex beams. The phase aberrations and orbital angular momentum in a vortex beam are proved to be mutually restrictive in parameter measurement. Aberrations make traditional topological charge (TC) probing methods ineffective while the phase singularity makes phase retrieval difficult due to the aliasing between the wrapped phase jump and the vortex phase jump. An interactive probing method is proposed to make measurements of the aberrated phase and orbital angular momentum in a vortex beam assist rather than hinder each other. The phase unwrapping is liberated from the phase singularity by an annular shearing interference technique while the TC value is determined by a Moiré technique immune to aberrations. Simulation and experimental results proving the method effective are presented. It is of great significance to judge the characteristics of vortex beams passing through non-ideal environments and optical systems.
1. INTRODUCTION
An optical vortex beam has a phase singularity with orbital angular momentum presenting helical phase fronts [1,2]. The vortex phase term implies an orbital angular momentum of with being the topological charge (TC). The TC value and phase distribution are typically the most important indices to characterize a vortex beam. A lot of studies focus on measuring the two characteristics but are limited to those of approximately ideal beams or those with small aberrations. An imperfect propagation environment or optical system would introduce large wavefront aberrations to the vortex beam, where measurements of both phase and TC are challenging [3].
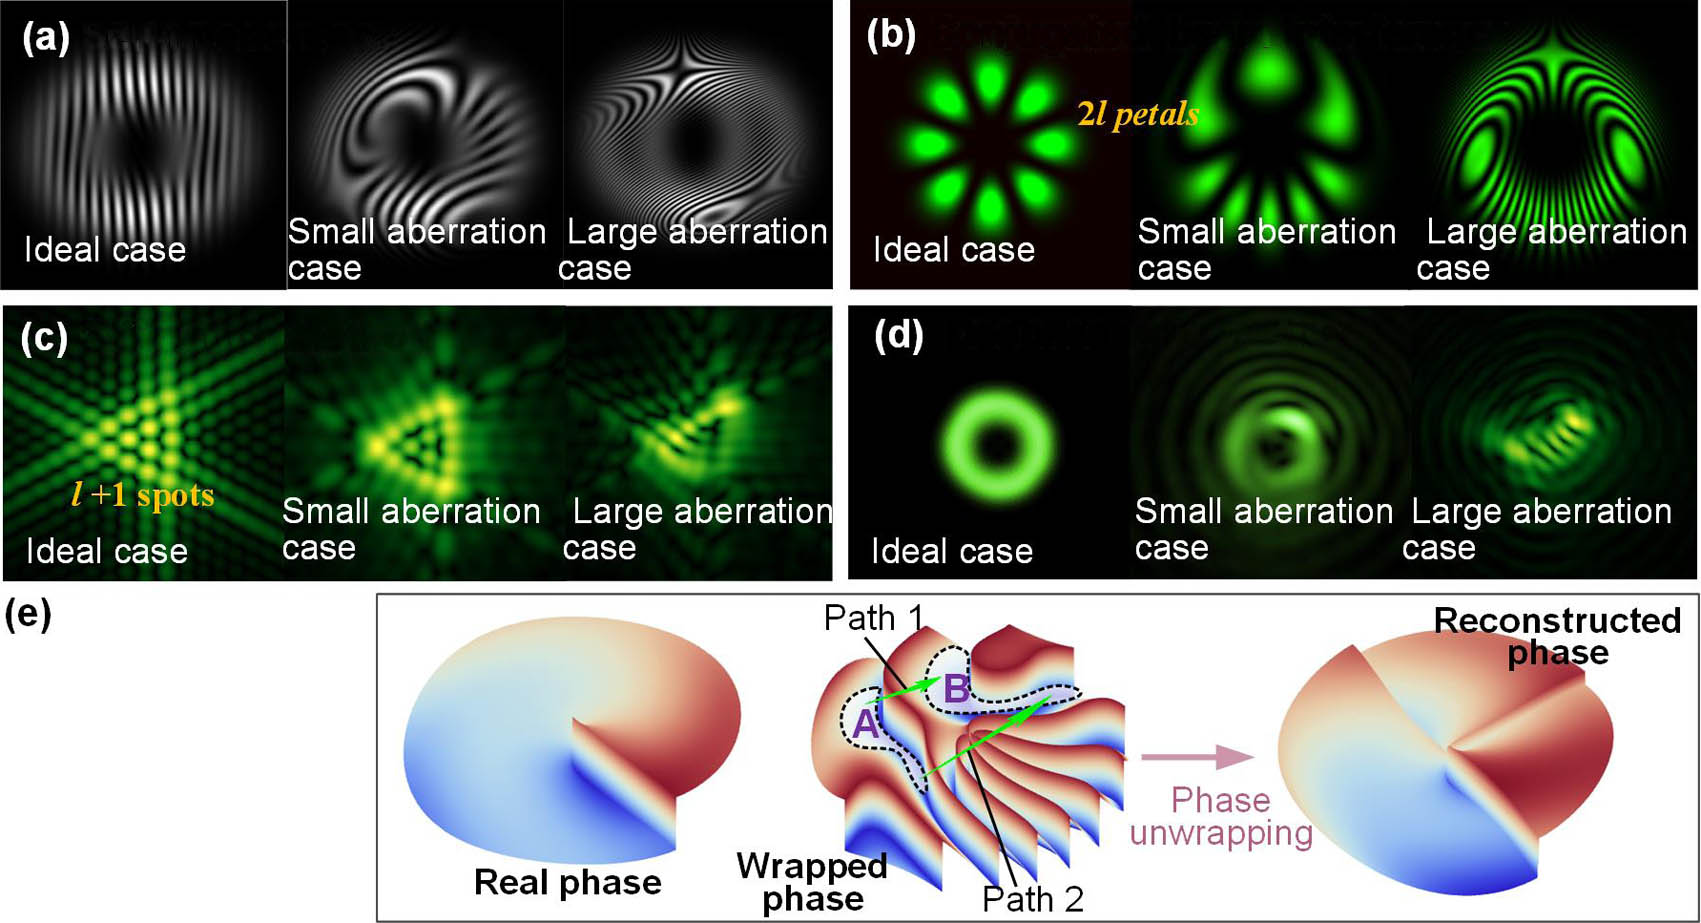
Several methods have been developed to determine the TC of vortex beams, such as diffraction methods [4–9], interferometry [10–18], mode transformation [19,20], and deep learning [21]. As the most intuitive method, interference and diffraction methods become mainstream procedures, which include self-interference [14,18], conjugated beam interference [16], multiple-pinhole interference [10,17], double-slit interference [11], single-slit diffraction [5], triangular aperture diffraction [4,6,9], annular aperture diffraction [13], and so on. All these methods depend on the judgment of subsequent regular intensity patterns, such as bifurcations of interference fringes [14], petals of conjugated vortex beam interference [16], and other regular diffraction patterns [10–17]. However, these distribution regularities would be broken in the case of a vortex beam of large aberrations, leading to a misdiagnosis of the TC number. The aberration sensitivity performance of traditional TC determination examples is shown in Figs. 1(a)–1(d). The bifurcations of interference fringes are indiscernible in the case of large and large aberrations due to the hollow intensity distribution and indistinguishable interference fringes, as shown in Fig. 1(a). Figure 1(b) illustrates the petals of the conjugated vortex beam interference pattern. With aberrations, the phase flip accompanied by the TC conjugation would break the regularities of petals, as shown in Fig. 1(b). Figure 1(c) illustrates the results of the triangular aperture diffraction method, in which aberrations make the original diffraction spots at the side of the triangle almost unrecognizable. Deep learning methods [22,23] enabled the TC determination of the beam with small aberrations by the simple hollow intensity image [Fig. 1(d)] and conjugated vortex beam interference pattern [Fig. 1(b)]. However, large aberrations would break the doughnut-like intensity or petals distribution completely, making the TC determination difficult. That is, the aberrations in the vortex beam make traditional TC probing methods not applicable.
Figure 1.Mutual restraining of TC determination and phase recovery in a vortex beam of aberrations, in which (a)–(d) are the effect of aberrations on TC measurements while (e) is the effect of TC on the aberration phase measurement. (a) Bifurcations of self-interference fringes, (b) conjugated vortex beam interference patterns, (c) triangular aperture diffraction patterns, (d) hollow intensity image from which TC is determined by deep learning, (e) phase unwrapping dilemma due to the phase jump aliasing in the vortex phase.
Meanwhile, phase recovery in a vortex beam of large aberrations is another challenge. Different from the traditional smooth and continuous phase fronts, the phase jump boundary naturally exists in the helical phase fronts due to the singularity. Interferometry provides an elegant performance with the phase-shifting technique for pixel-level accurate phase demodulation [24,25]. However, the wrapped phase jump and the vortex phase jump are aliased together and unable to be distinguished, which would lead to the failure of phase unwrapping [26]. As is shown in Fig. 1(e), paths 1 and 2 in the wrapped phase provide distinct different solutions for the phase jump compensation from area A to B, respectively. That is, the phase unwrapping would be ambiguous due to the phase jump aliasing. Pre-designed unwrapping paths [26] would relieve the phase jump aliasing but be inoperative in the case of large aberrations because the complex phase jump boundaries make the pre-design of unwrapping paths impossible.
Sign up for Photonics Research TOC. Get the latest issue of Photonics Research delivered right to you!Sign up now
Therefore, we conclude that the aberrated phase and TC restrict measurements of each other. Previous studies have focused on the respective measurement of the two characteristics, without concerning the mutual restraint between the two measurements in a beam of large aberrations. The simultaneous recovery of the aberration phase and TC number has not been reported previously. In this paper, we propose an interactive probing method in a dual-interferometer structure to determine the aberration phase and TC value, which separates the cross-impact between the two parameters. A singularity-immune annular radial shearing interferometer separates the phase unwrapping from the vortex phase jump, which makes the phase recovery as simple as the traditional smooth phase. With the recovered aberration phase, an aberration-immune virtual Moiré probe is generated to determine the TC. The relationship between the two characteristic measurements has changed from being mutually restrictive to complementary. Simulation and experimental results proving the method effective are presented.
2. PRINCIPLE
As a kind of LG beam, the electric field of the vortex beams of aberrations can be simplified as where is the amplitude, and and are the TC value and phase term related to aberrations, respectively. is the angular coordinate. To measure and , the dual-interferometer structure employed is presented in Fig. 2, which consists of a Twyman–Green interferometer and an annular radial shearing interferometer [27].
Figure 2.Principle of the interactive probing method. The system consists of a Twyman–Green interferometer and an annular radial shearing interferometer. The two interferometers capture the purified interferogram and radial shearing interferogram, respectively. The RCP and LCP beams before the P-cameras in the two interferometers are designed to meet the synchronous phase shift condition. The aberration phase extracted from the shearing interferogram is used to generate a virtual interferogram. The Moiré probes then can be extracted from the product of the purified interferogram and virtual interferogram.
The Twyman–Green interferometer is employed to acquire the direct interferogram of the vortex beam and reference collimated beam. The polarized beam splitter (PBS 1) divides the incident vortex beam with circular polarization into two parts. The reflected -polarized part of the vortex beam meets the collimated reference beam (-polarized) at a quarter-wave plate (QWP). The QWP transforms the two linearly polarized beams into the right-rotated circularly polarized (RCP) and left-rotated circularly polarized (LCP) ones, respectively. A pixelated polarizing camera (P-camera 1) is employed to capture the interferogram. The P-camera is equipped with a pixelated polarization mask, making four adjacent pixels have polarization directions that differ by 45°. Therefore, four spatial phase shift interferograms [24,25] with phase shift between adjacent two would be acquired simultaneously by interval pixel extraction: where is the reference beam amplitude. Due to aberrations in the vortex beam, the four interferograms with dense even indistinguishable fringes are employed not for phase extraction but for eliminating the influence of background intensity. The purified interferogram that is insusceptible to the background and modulation can be acquired as shown in Eq. (3):
A. Phase Recovery with Singularity Isolation
The annular radial shearing interferometer is employed to capture the interferogram with the phase singularity influence removed. The -polarized part of the vortex beam transmitting PBS 1 is transformed into an LCP beam again and enters into the annular radial shearing interferometer. The shearing interferometer employs an annular beam path which makes two beams splitting from PBS 2 travel clockwise and counterclockwise, respectively. With two lenses of different focal lengths ( and ) in the annular beam path, the two reversely-propagated beams have diameter magnification factors of s and 1/s, respectively. The is the so-called shearing ratio. The two beams eventually remeet at PBS 2, with polarized directions perpendicular to each other. The P-camera 2 is employed to capture the shearing interferogram after the two beams travel through a QWP. In the radial shearing interferometer, the amplitude and phase of the two beams are respectively expressed as functions of the radius and angular as follows: where and are the amplitudes of shrunken and expanded beams in the shearing interferometer, respectively. Therefore, the shearing interferogram is then written as where and . It can be seen from the shearing phase that the phase factor of the vortex beam is canceled out in the interference result, and only the aberration phase exists. Thus, the phase jump due to the original vortex singularity no longer affects the phase retrieval. The shearing phase can be extracted by the phase shift interferograms captured by the P-camera 2. The radial shearing phase recovery (RSPR) algorithm [28,29] is used to iteratively recover the original phase :
B. TC Determination
With the recovered phase , we can easily get a virtual interferogram with the aberration only: Then a Moiré fringe pattern is generated by the virtual interferogram in Eq. (7) and the purified interferogram in Eq. (3) as follows:
It is obvious that the vortex phase () is separated from the aberration phase in the Moiré fringe pattern in Eq. (8). We extracted the Moiré probes, the outline of indicating TC, from the mixed phase . The measurement of TC by Moiré probes does not only suffer from aberration but makes use of it. With an optical wedge, a carrier phase can be introduced to the incident phase . Equation (8) is thus revised as
The carrier phase would make the term separated from the term in the frequency domain. With a Fourier transformation for the Moiré fringe pattern , , as the low frequencies of , can be extracted immune to the influence of . The outline of has petals, being the natural pointer of TC, which are called “Moiré probe” in this paper. This process can be expressed as follows: where FT and IFT refer to the operations of Fourier transformation and inverse Fourier transformation, respectively. denotes the low-pass filter operator.
The sign of the TC is determined by a simple digital phase shifting. With the recovered , the phase shifting virtual interferogram can be calculated by , where is serials of virtual phases referring to constant matrices added artificially. It is a simple phase subtraction operation. Therefore, the Moiré probe in Eq. (10) would be changed to according to Eq. (8). The new Moiré probe has the same petals as except for the rotation of [30]. We assume which implies that and have the same sign in case of positive . Therefore, the sign of can be determined by the sign of . The counterclockwise rotation of the Moiré probes would confirm the positive with a series of incremental positive . The clockwise rotation refers to negative .
3. SIMULATION
Simulation examples () of phase recovery and TC determination by the proposed method are presented in Visualization 1 with intermediate data, which shows the result variations in the cases of peak-to-valley (PV) value of the incident aberrations rising from to . Figures 3(a)–3(d) present three groups of phase recovery results (three examples in Visualization 1) with increasing incident aberrations in the three rows. The PV values of the incident aberration in the vortex beam in Fig. 3(a) are , , and , respectively. With the singularity elimination effect of the shearing interferometer, the aberration phases are thus recovered with PV errors. Visualization 2 illustrates the TC determination results in the cases of increasing incident aberrations, with the comparison to traditional methods mentioned in Section 1. Corresponding to the three aberration cases shown in Fig. 3(a), Figs. 3(e)–3(h) present the comparison of the TC determination results, which refer to the Moiré probes, far-field spots, triangular aperture diffraction spots, and conjugated interference petals, respectively. In all these results, only Moiré probes stay at a constant Moiré probe number 4, as shown in Fig. 3(e), which shows the aberration insensitivity of the proposed method.
Figure 3.Phase recovery and TC determination results with increasing incident aberrations. (a) Incident vortex phases with aberrations, (b) direct interferograms with the carrier, (c) shearing interferograms, (d) recovered phases and recovered errors, (e) Moiré probes, (f) far-field spots, (g) triangular aperture diffraction spots, (h) conjugated interference petals.
Figure 4 presents the performance of the method in the case of different TCs and aberration types. The four-row images refer to the results in the case of with different aberrations, respectively. Figure 4(a) presents the real vortex phases with aberrations (). Figures 4(b) and 4(c) refer to the purified interferograms with carrier phase and the shearing interferograms (), which are captured by P-cameras 1 and 2, respectively. Figure 4(d) shows phases recovered from the shearing interferograms with the carrier phase removed. The recovered smooth phase shows the immunity of the method to the phase jump of the original vortex characteristic. The corresponding virtual interferograms with carrier phase are shown in Fig. 4(e). With , the Moiré fringe patterns and Moiré probes are illustrated in Figs. 4(f) and 4(g), respectively. The Moiré probes present the accurate petal number immune to phase aberrations. Figure 4(h) presents the recovered vortex phases, a superposition of the recovered aberration phase and the basic helical phase. Phase recovery errors are shown in Fig. 4(i), which provides the same accuracy as the traditional shearing phase recovery.
Figure 4.Simulation results of TC determination and phase recovery in the case of with different aberration types. (a) Real vortex phases with aberrations (), (b) purified interferograms () with carrier phase, (c) shearing interferograms (), (d) recovered phases () referring to aberrations, (e) virtual interferograms () with carrier phase, (f) Moiré fringes (), (g) Moiré probes, (h) recovered vortex phase (), (i) recovered phase error.
The TC sign determination is simulated in Visualization 3. According to Eq. (11), the counterclockwise rotation of the Moiré probes would confirm the positive with a series of incremental positive . Otherwise, is negative. With serials of virtual phase as the digital phase shifting for phase , the rotations of the four Moiré probe patterns in Fig. 4(g) are shown in Visualization 3, with the keyframes shown in Fig. 5. We can confirm the corresponding TC sign as , respectively.
Figure 5.Sign determination of TC. These pictures are the keyframes of Visualization 3 showing the obvious rotation.
We then examined the resolution of our proposed method for fractional TCs with a camera of one megapixel. A complete probe refers to the same angular width as others while the fractional TC would induce several incomplete probes splitting from the complete one. Figure 6 illustrates the TC estimation simulation results corresponding to .
Figure 6.Determination of the fractional TC with a camera of one megapixel. (a) Probes with TC between 6 and 7 spaced 0.1 apart, (b) GS curves which indicate the split process of corresponding TC probes. (c) and accordingly calculated , (d) error of TC estimation.
Figure 6(a) presents probe images with TC between 6 and 7 spaced 0.1 apart, which shows us the new probe splitting process. It suggests the inaccuracy of determining the TC only by the number of probes. The quantitative angular width of probes or adjacent probe angular spacing can act as the new index to describe the fractional TC. To quantify the angular width of these petals and their septa, the gray sum curve (GS curve) of the radial pixel along the polar angle is introduced. The angular coordinate of the GS curve is the polar angle from 0° to 360° and the radius coordinate is the sum of normalized radial pixel gray at the corresponding polar angle. Each peak of the GS curve refers to a radius of the maximum gray sum, which implies a petal. Figure 6(b) presents the GS curves of TC values 6–7 with 0.1 apart. Each petal splitting represents the growth of two new petals and a new petal spacing. The growing petal spacing is narrower than other complete ones. After a lot of simulation verification, we proposed an empirical formula to calculate the fractional part of the TC, as a correction to simple petal counting: where the refers to the peak spacing number. is the average angular spacing along the polar angle. The is the angular spacing of the split probes, which is usually one of the smallest angular spacing between all the peaks. Figure 6(c) presents and the calculated accordingly, with the error shown in Fig. 6(d). Specific results are listed in Table 1, which provides a maximum TC error of 0.046. Therefore, a TC resolution of less than 0.1 is achieved with a camera of one megapixel. With more pixels, a more accurate determination is available.
Determination Results of the Fractional Part of Topological Charge with a Camera of One Megapixel
Real
6.1
6.2
6.3
6.4
6.5
6.6
6.7
6.8
6.9
7
4.01
10.03
17.05
22.08
28.09
33.10
38.11
42.11
47.12
52.12
6.078
6.195
6.332
6.429
6.546
6.644
6.741
6.819
6.916
6.999
Error
−0.022
−0.005
0.032
0.029
0.046
0.044
0.041
0.019
0.016
−0.001
4. DISCUSSION
For the Moiré probe images, the measurable maximum TC limit depends on the pixel number of the camera. In theory, three pixels in a circle allow two petals to be distinguished. A camera of one megapixel has 2260 pixels counted in the outermost circle at the sensor, promising about 1130 petals counting and thus the largest measurable TC . Considering the tolerance, the largest measurable TC would be when expanding the resolution of two petals to 12 pixels (1.91°). The in Eq. (12) promises the maximum resolution of the fraction part of the TC, which refers to a different resolution value with different due to the TC value. With the , the promises the maximum TC resolution of about , which is basically consistent with those shown in Fig. 6. According to Eq. (12), the resolution of the TC would gradually decrease with diminution due to the TC number increase. Figure 7(a) presents the TC resolution variations with the increasing TC number. It shows us the TC resolution over 1 in the case of , which illustrates the limiting ability of TC counting in a megapixel camera. We estimate the error performance of TC determination in the case of , with the results shown in Fig. 7(b). Error bars indicate that each determination was performed at five different aberration levels. The three cases provide increasing absolute values of the error as shown in Fig. 7(c), which verifies the conclusion that the resolution decreases with the increase of measured TC number. Note that the trendline in Fig. 7(c) is high in the middle and low on both sides, which shows the larger measurement error of fractional TC than that of integer TC generally. This is because the adjacent splitting probes have adhesions in the case of fractional TC. The adhesion is prevalent in the adjacent splitting probes of the fractional TC, although it is not visually obvious in some images in Fig. 6(a). The adhesions would affect the determination of and thus the TC. The Moiré probe image of the integer TC has the largest splitting probe interval and thus the smallest adhesion effect. Thus, the determination error of the fractional TC is relatively larger than those of the TC of integers.
Figure 7.TC resolution analysis with a one-megapixel camera. (a) TC resolution variations with the increasing TC number, (b) error performance of TC determination in the cases of . (c) Absolute values of the errors in the three cases.
Another error consideration is the system structure. Just like diffraction methods for TC determination, the alignment of the beam singularity and the diffraction aperture is a must [4,17]. In our method, the beam wavefront singularity must be aligned with the shearing center of the annular shearing interferometer to ensure the vortex phase can be eliminated completely by the phase shearing. Figure 8 shows the simulation results of misalignment. The shearing center is generally the center of the phase matrix by default. A new phase matrix, truncated eccentrically from a phase matrix of a singularity at the center, is employed to simulate the misalignment. The incident phase with an exocentric singularity is shown in Fig. 8(a), which implies the misalignment of the singularity and shearing center. The purified interferogram and the shearing interferogram are presented in Figs. 8(b) and 8(c), respectively. The shearing interferogram shows obvious double singularity separation due to the misalignment, which means the phase singularity is not removed completely. Therefore, multiple phase jumps that should not exist appear in the recovered phase as shown in Fig. 8(d), which presents the inaccurate recovered phase. The resulting virtual interferogram in Fig. 8(e) shows the corresponding singularity separation as well. However, the local detail does not affect the overall low spatial frequency of Moiré fringes [Fig. 8(f)], whose profile refers to the Moiré probe in Fig. 8(g). Except for center deviation, these local phase recovery errors due to the misalignment do not affect the Moiré probe number determination. Of course, the center deviation would make the smallest probe take up fewer pixels and thus decrease the resolution.
Figure 8.Simulation of TC determination and phase recovery in the case of misalignment and phase recovery error. (a) Incident vortex phases with exocentric singularity, (b) purified interferogram, (c) shearing interferogram, (d) recovered phase referring to aberrations, (e) virtual interferograms, (f) Moiré fringes, (g) Moiré probes, (h) TC determination error due to 1% phase recovery error in the cases of different beam aberrations and TC.
Even with an aligned system, the influence of the inherent phase recovery error deserves discussion. The phase recovery in the radial shearing interferometer has been focused on by many researchers and the relative rms error can achieve about 1% [27,31]. With the increasing beam aberration, the absolute error of the recovered phase rises as well. The error of the in the Moiré probes would thus be introduced and it has a positive correlation with the absolute phase error. Therefore, the TC determination error has a positive correlation with the absolute phase error as well. The error performance has been simulated as shown in Fig. 8(h), in which the rms value of the beam aberration increases from to , with 1% rms errors in recovered phases artificially added. The corresponding PV value is from to . Beams of three different TC numbers () were evaluated. From Fig. 8(h), less than 0.03 TC determination error is induced, which is far less than the resolution of our method. Simulation shows that even if the aberration PV value reaches , the TC error caused by the phase recovery error in the shearing interferometer is only about 0.09, which is still smaller than our TC measurement resolution. Aberrations of this magnitude are unusual in practice, as the beam may already be severely deformed. Therefore, the inherent error of the radial shearing phase recovery is negligible in general measurement.
Although Moiré probes achieve aberration immunity, the technique requires the participation of an additional reference beam. Therefore, it cannot be applied where a reference beam is not available. If the aberration is accompanied by the spectrum dispersion [32,33] of the orbital angular momentum when the beam passes through a strong random turbulence, the proposed method may be ineffective due to multiple singularities to be measured.
5. EXPERIMENT
We set up an experimental system to validate the proposed method, as shown in Fig. 9(a). The system is built following the two interferometer structures as shown in Fig. 2. The difference is that the incident vortex beam is generated by a reflective spatial light modulator (SLM). The specific beam path is illustrated in Fig. 9(b). A He–Ne laser () beam was expanded to 15 mm diameter, which was reflected to an SLM by PBS 1 and BS. The SLM from Hamamatsu Photonics was employed to modulate the collimated beam to the vortex beam of aberrations (the green arrow). The carrier phase was provided by the SLM as well. As the tested beam, it was then divided into two parts by BS 1. The two parts entered the Twyman–Green interferometer and annular radial shearing interferometer separately. The shearing ratio . The P-camera employed is a Sony IMX250MZR CMOS sensor with five megapixels. Each interferogram has only 1.25 megapixels before interpolation. It implies the maximum measurable TC number is about 200, which is comparable to the simulation.
The comparative experiments were carried out in the previously mentioned methods and the proposed method. The SLM provided vortex beams of with different aberrations. The PV values of the incident aberration (mixture of spherical and coma aberrations) in the vortex beam are , , and , respectively. Figures 10(a)–10(d) present the comparison of the TC determination results, which refer to the triangular aperture diffraction spots, far-field spots, conjugated interference petals, and Moiré probes, respectively. Each set of three images corresponds to the cases of three different aberrations. Figures 10(a)–10(c) show us that these methods cannot work in large aberration cases while only Moiré probes stay at a constant number 4, which shows the aberration insensitivity of the proposed method.
Figure 10.Comparative experiment results with different aberrations in different methods. Each set of three images corresponds to the cases of three different aberrations. (a) Triangular aperture diffraction spots, (b) far-field spots, (c) conjugated interference petals, (d) Moiré probes.
Figure 11.Experiment results of TC determination and phase recovery in the case of with different aberrations. (a) Real aberration phases, (b) direct interferograms with carrier phases captured by P-camera 1, (c) shearing interferograms captured by P-camera 2, (d) recovered phases referring to aberrations, (e) virtual interferograms, (f) Moiré fringes, (g) Moiré probes, (h) GS curves.
Measurements of the wavefront phase and topological charge of vortex beams carrying large aberrations are restricted by each other. We proposed an interactive probing solution with a dual-interferometer structure. The phase singularity-immune radial shearing interferometer is employed to recover the aberration phase. The phase recovery accuracy is the same as the traditional shearing interference phase recovery in case of alignment. With the recovered aberration phase, the aberration-immune Moiré probe is proposed to characterize the TC number. The measured TC number would be used to complement the vortex phase feature. The aberration and TC are proven not to restrict measurements of each other in this method. To achieve fine Moiré probe counting, the GS curve is employed to calculate the TC (especially fractional TC) number. With a tolerance of 12 pixels per two probes, 0.01 resolution and a maximum 200 measurable range of the TC number are achievable with a camera of one megapixel. The measurement accuracy of the integer TC is higher than that of the fractional TC. The beam wavefront singularity must be aligned with the shearing center of the shearing interferometer to ensure phase recovery accuracy. Even in the case of misalignment, the integer TC number can be determined accurately. Experiments achieved measurement of maximum aberration with PV error in the case of and maximum with 0.073 TC error in the case of aberration. was measured as well with about 0.1 resolution. It is of great significance to judge the characteristics of vortex beams after passing through imperfect environments and optical systems.
Shengyang Wu, Benli Yu, Lei Zhang, "Mutual aid instead of mutual restraint: interactive probing for topological charge and phase of a vortex beam of large aberrations," Photonics Res. 12, 172 (2024)
 AI Video Guide
  AI Picture Guide
 AI One Sentence