• Advanced Photonics
  • Vol. 2, Issue 3, 036002 (2020)
Zhixiong Shen1、2, Shenghang Zhou1, Xinan Li1, Shijun Ge1、2, Peng Chen1、2, Wei Hu1、2、*, and Yanqing Lu1、*
Author Affiliations
  • 1Nanjing University, College of Engineering and Applied Sciences, National Laboratory of Solid State Microstructures, Key Laboratory of Intelligent Optical Sensing and Manipulation, Collaborative Innovation Center of Advanced Microstructures, Nanjing, China
  • 2Jiangsu Industrial Technology Research Institute, Institute for Smart Liquid Crystals, Changshu, China
  • show less
    DOI: 10.1117/1.AP.2.3.036002 Cite this Article Set citation alerts
    Zhixiong Shen, Shenghang Zhou, Xinan Li, Shijun Ge, Peng Chen, Wei Hu, Yanqing Lu. Liquid crystal integrated metalens with tunable chromatic aberration[J]. Advanced Photonics, 2020, 2(3): 036002 Copy Citation Text show less
    Schematic function tunability and designs of the metalens. (a) The broadband achromatic focusing state without bias. (b) The dispersive focusing state with a saturated bias. The superstrate depicts the dielectric metasurface while the blue ellipsoids between the superstrate and substrate denote LCs. (c) Dependencies of φR (red curve) and PCR of a silicon pillar metaunit on f. Inset shows the dimensions of the unit. Dependency of φR on l and w at (d) 0.9 and (e) 1.4 THz, respectively. (f) Dispersion ratio of the silicon pillar as a function of l and w under LCP incidence. Dependency of PCR on l and w at (g) 0.9 and (h) 1.4 THz. The region circled by the black dashed line indicates a PCR over 12% from 0.9 to 1.4 THz. (i) Designed l and w of the silicon pillars along r from the center to the edge. (j) φA and φR at 0.9 (blue solid and dashed curves) and 1.4 THz (red solid and dashed curves) and residual φG. (k) Target φG and corresponding LC director distributions are labeled by the orange lines.
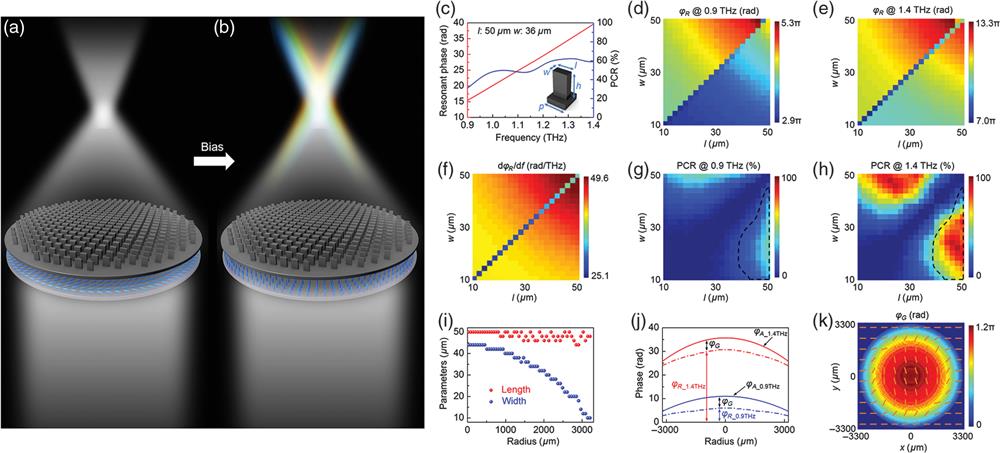
    Fig. 1. Schematic function tunability and designs of the metalens. (a) The broadband achromatic focusing state without bias. (b) The dispersive focusing state with a saturated bias. The superstrate depicts the dielectric metasurface while the blue ellipsoids between the superstrate and substrate denote LCs. (c) Dependencies of φR (red curve) and PCR of a silicon pillar metaunit on f. Inset shows the dimensions of the unit. Dependency of φR on l and w at (d) 0.9 and (e) 1.4 THz, respectively. (f) Dispersion ratio of the silicon pillar as a function of l and w under LCP incidence. Dependency of PCR on l and w at (g) 0.9 and (h) 1.4 THz. The region circled by the black dashed line indicates a PCR over 12% from 0.9 to 1.4 THz. (i) Designed l and w of the silicon pillars along r from the center to the edge. (j) φA and φR at 0.9 (blue solid and dashed curves) and 1.4 THz (red solid and dashed curves) and residual φG. (k) Target φG and corresponding LC director distributions are labeled by the orange lines.
    Characterization of the metalens. (a) SEM image of the metasurface (top view). Scale bar: 300 μm. Zoomed-in images of the silicon pillars labeled by the (b) orange and (c) blue squares in (a), respectively. (d) Cross-section image of the metasurface. Scale bars in (b)–(d): 100 μm. (e) Optical image of the LC layer under crossed polarizers. (f) A zoomed-in image labeled by the orange square in (e). Scale bars in (e) and (f) are 1 mm and 500 μm, respectively.
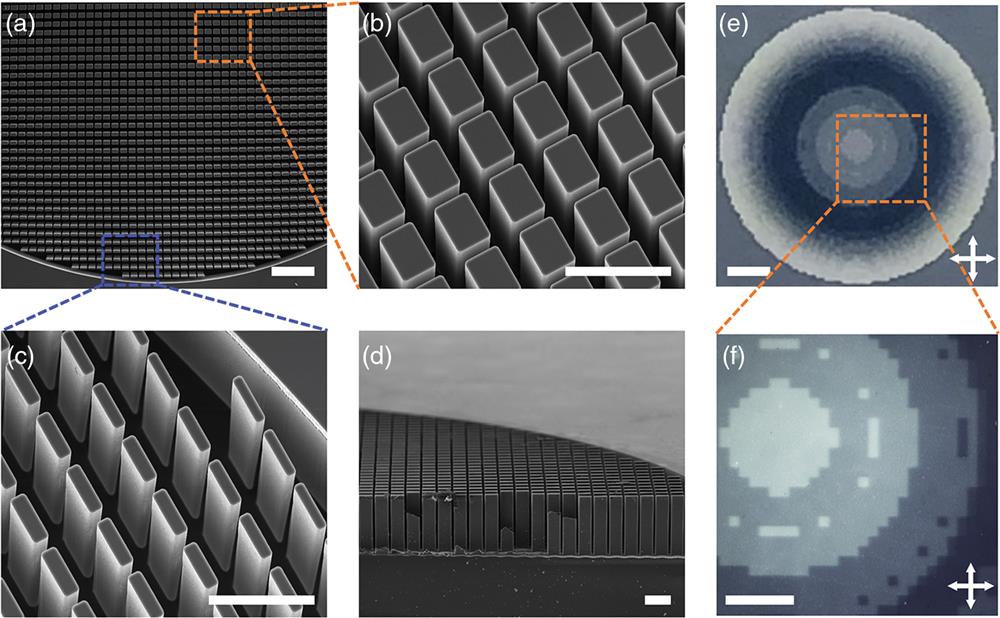
    Fig. 2. Characterization of the metalens. (a) SEM image of the metasurface (top view). Scale bar: 300  μm. Zoomed-in images of the silicon pillars labeled by the (b) orange and (c) blue squares in (a), respectively. (d) Cross-section image of the metasurface. Scale bars in (b)–(d): 100  μm. (e) Optical image of the LC layer under crossed polarizers. (f) A zoomed-in image labeled by the orange square in (e). Scale bars in (e) and (f) are 1 mm and 500  μm, respectively.
    Focusing performance of the metalens. (a) Simulated THz fields in the xz plane and (b) measured THz fields in the xz and xy plane (z=12.0 mm) at 0.9, 1.1, and 1.4 THz, respectively, when no bias is applied. (c) Simulated and (d) measured THz fields in the xz and xy plane (z=13.0 mm) of the same sample with a saturated bias. Dashed lines in (a)–(d) label the corresponding focal planes. White curves in (b) and (d) depict the transverse intensity distributions at z=12.0 and 13.0 mm, respectively. (e) Simulated and measured F, (f) FWHM at z=12.0 and 13.0 mm in (b) and (d), separately, and (g) measured device efficiency, as a function of f. The black dashed line in (f) depicts the diffraction-limited FWHM.
    Fig. 3. Focusing performance of the metalens. (a) Simulated THz fields in the xz plane and (b) measured THz fields in the xz and xy plane (z=12.0  mm) at 0.9, 1.1, and 1.4 THz, respectively, when no bias is applied. (c) Simulated and (d) measured THz fields in the xz and xy plane (z=13.0  mm) of the same sample with a saturated bias. Dashed lines in (a)–(d) label the corresponding focal planes. White curves in (b) and (d) depict the transverse intensity distributions at z=12.0 and 13.0 mm, respectively. (e) Simulated and measured F, (f) FWHM at z=12.0 and 13.0 mm in (b) and (d), separately, and (g) measured device efficiency, as a function of f. The black dashed line in (f) depicts the diffraction-limited FWHM.
    Broadband THz imaging. (a) Schematic of the SNTM setup. The inset exhibits the micrograph of the object “smiling face,” where the scale bar indicates 1 mm. Measured intensity and phase distributions at (b) 0.9 and (c) 1.4 THz without bias. The white and orange curves depict the intensity profiles along the white and orange dashed lines, respectively. The outline of the object “smiling face” is labeled by black dashed lines in the phase diagrams. Measured intensity and phase distributions at (d) 0.9 and (e) 1.4 THz with a saturated bias.
    Fig. 4. Broadband THz imaging. (a) Schematic of the SNTM setup. The inset exhibits the micrograph of the object “smiling face,” where the scale bar indicates 1 mm. Measured intensity and phase distributions at (b) 0.9 and (c) 1.4 THz without bias. The white and orange curves depict the intensity profiles along the white and orange dashed lines, respectively. The outline of the object “smiling face” is labeled by black dashed lines in the phase diagrams. Measured intensity and phase distributions at (d) 0.9 and (e) 1.4 THz with a saturated bias.
    Zhixiong Shen, Shenghang Zhou, Xinan Li, Shijun Ge, Peng Chen, Wei Hu, Yanqing Lu. Liquid crystal integrated metalens with tunable chromatic aberration[J]. Advanced Photonics, 2020, 2(3): 036002
    Download Citation