
Yiqing Chang, Hao Wu, Can Zhao, Li Shen, Songnian Fu, Ming Tang. Distributed Brillouin frequency shift extraction via a convolutional neural network[J]. Photonics Research, 2020, 8(5): 690
- Photonics Research
- Vol. 8, Issue 5, 690 (2020)
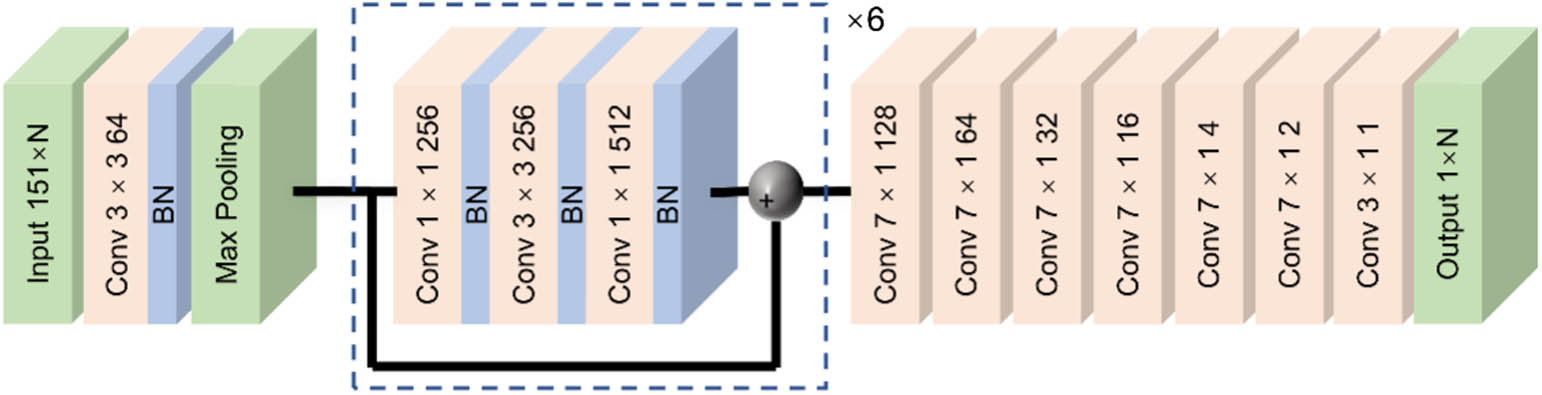
Fig. 1. Architecture of the proposed BFSCNN.
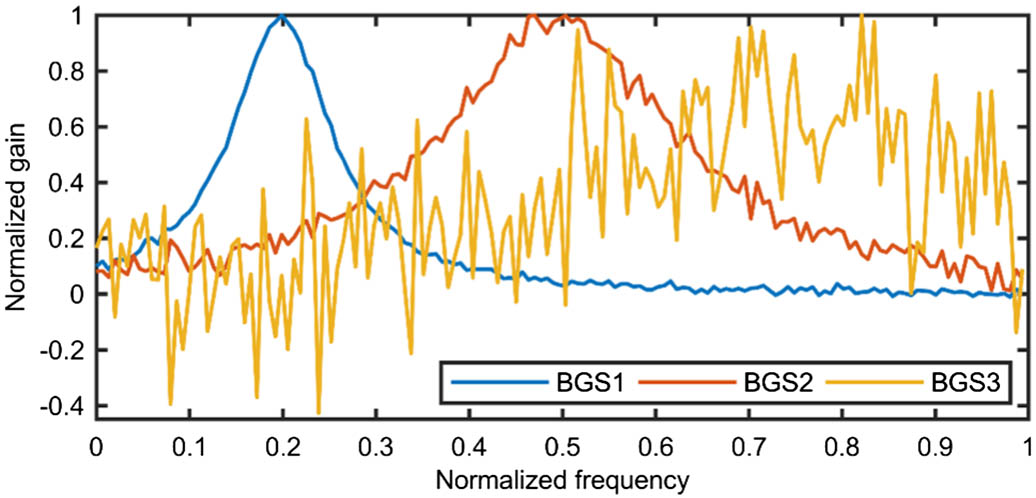
Fig. 2. Normalized simulation BGSs. BGS1: BFS = 20 % SW = 13 % SNR = 20 dB BFS = 50 % SW = 30 % SNR = 15 dB BFS = 73 % SW = 50 % SNR = 10 dB
Fig. 3. Simulation data used for training. (a) Simulation BGSs of random parameters; (b) corresponding BFSs.
Fig. 4. Experimental setup of the BOTDA system. EOM, electro-optic modulator; MS, microwave synthesizer; PS, polarization switch; FUT, fiber under test; SOA, semiconductor optical amplifier; AFG, arbitrary function generator; EDFA, erbium-doped fiber amplifier; BPF, bandpass filter; BVTF, bandwidth-variable tunable filter; PD, pin photodetector.
Fig. 5. Normalized BFS RMSE and SD of the simulation data. (a) Normalized RMSE and (b) SD for different SNR data; (c) normalized RMSE and (d) SD for different BFS data; (e) normalized RMSE and (f) SD for different SW data.
Fig. 6. Performance differences in BFSs extracted by the LCF and BFSCNN. (a) Normalized BFS RMSE using the LCF minus the normalized BFS RMSE using the BFSCNN for different simulation data. (b) Normalized BFS SD using the LCF minus the normalized BFS SD using the BFSCNN for different simulation data.
Fig. 7. Measurement results when the pump pulse width is 40 ns and the average time is 32. (a) Measured BGSs along an optical fiber; (b) distributed BFSs extracted by LCF and BFSCNN.
Fig. 8. BFS uncertainty as a function of fiber length. BFS uncertainty traces when the pump pulse width is (a) 20 ns, (b) 30 ns, and (c) 40 ns.
Fig. 9. Extracted BFSs along the optical fiber when the fiber end is heated. The inset image shows the BFS profiles around the start of the heat section.
|
Table 1. Test Parameters

Set citation alerts for the article
Please enter your email address
© Copyright 2018-2021 | Chinese Laser Press. All Rights Reserved 沪ICP备15018463号-20