• Photonics Research
  • Vol. 8, Issue 12, 1937 (2020)
Shujie Pan1、†, Jianou Huang2、†, Zichuan Zhou1, Zhixin Liu1, Lalitha Ponnampalam1, Zizhuo Liu1, Mingchu Tang1, Mu-Chieh Lo1, Zizheng Cao2、5, Kenichi Nishi3, Keizo Takemasa3, Mitsuru Sugawara3, Richard Penty4, Ian White4, Alwyn Seeds1, Huiyun Liu1, and Siming Chen1、*
Author Affiliations
  • 1Department of Electronic and Electrical Engineering, University College London, Torrington Place, London, WC1E 7JE, United Kingdom
  • 2Institute of Photonic Integration, Eindhoven University of Technology, Eindhoven 5600 MB, The Netherlands
  • 3QD Laser, Inc., Kawasaki 210-0855, Japan
  • 4Centre for Photonics Systems, Department of Engineering, University of Cambridge, Cambridge CB3 0FA, United Kingdom
  • 5e-mail: z.cao@tue.nl
  • show less
    DOI: 10.1364/PRJ.399957 Cite this Article Set citation alerts
    Shujie Pan, Jianou Huang, Zichuan Zhou, Zhixin Liu, Lalitha Ponnampalam, Zizhuo Liu, Mingchu Tang, Mu-Chieh Lo, Zizheng Cao, Kenichi Nishi, Keizo Takemasa, Mitsuru Sugawara, Richard Penty, Ian White, Alwyn Seeds, Huiyun Liu, Siming Chen. Quantum dot mode-locked frequency comb with ultra-stable 25.5 GHz spacing between 20°C and 120°C[J]. Photonics Research, 2020, 8(12): 1937 Copy Citation Text show less
    (a) Cross-sectional TEM image of the active region. The inset shows the high-resolution bright-field scanning TEM image of a single dot. (b) Comparison of the room temperature PL spectra for samples grown under previous conditions and the optimized growth conditions employed in this work. (c) Schematic of the passive two-section MLL. (d) SEM image of the device showing the gap between the gain and SA.
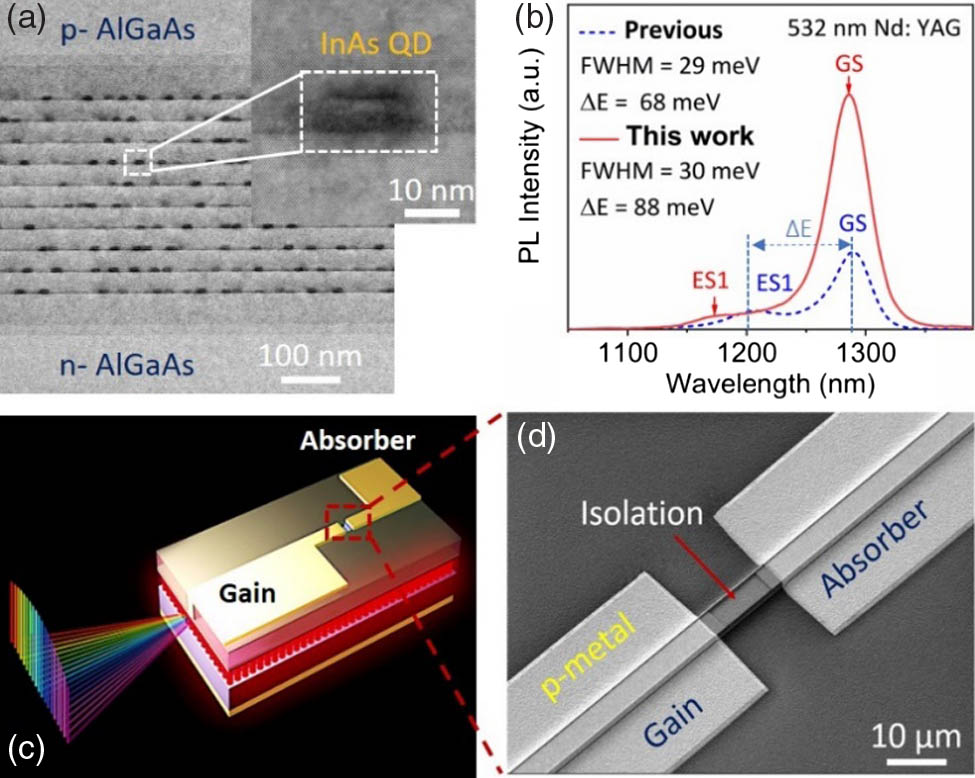
    Fig. 1. (a) Cross-sectional TEM image of the active region. The inset shows the high-resolution bright-field scanning TEM image of a single dot. (b) Comparison of the room temperature PL spectra for samples grown under previous conditions and the optimized growth conditions employed in this work. (c) Schematic of the passive two-section MLL. (d) SEM image of the device showing the gap between the gain and SA.
    Two-section passive QD-MLL performance characterization at room temperature. (a) L−I characteristics for different SA reverse-bias voltages. (b) Fundamental RF peak SNR mapping. (c) RF spectrum in a 26.5 GHz span view (RBW: 1 MHz, VBW: 10 kHz). The inset shows the autocorrelation trace with Gaussian pulse fitting. (d) Pulse duration as a function of Igain with VSA=−3.5 V.
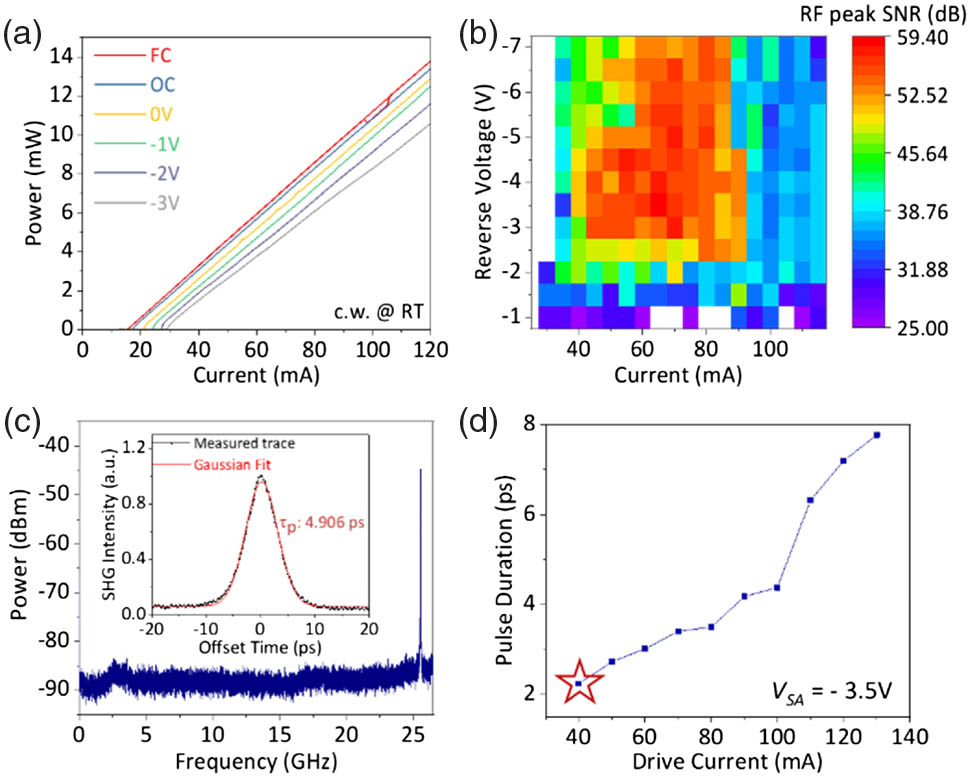
    Fig. 2. Two-section passive QD-MLL performance characterization at room temperature. (a) LI characteristics for different SA reverse-bias voltages. (b) Fundamental RF peak SNR mapping. (c) RF spectrum in a 26.5 GHz span view (RBW: 1 MHz, VBW: 10 kHz). The inset shows the autocorrelation trace with Gaussian pulse fitting. (d) Pulse duration as a function of Igain with VSA=3.5  V.
    (a) Typical CW L−I characteristics of the two-section QD MLL as a function of temperature when VSA=0 V. (b) Dependence of threshold current on reverse-bias voltage and temperature.
    Fig. 3. (a) Typical CW LI characteristics of the two-section QD MLL as a function of temperature when VSA=0  V. (b) Dependence of threshold current on reverse-bias voltage and temperature.
    Temperature-dependent characteristics of two-section passive QD-MLL with a constant VSA=−2 V and Igain of 49, 60, 64.7, 85, 148.5, and 210 mA at 20, 40, 60, 80, 100, and 120°C, respectively. (a) RF spectra (RBW: 1 MHz, VBW: 10 kHz). (b) Zoomed-in RF spectra, as shown in (a). (c) Pulse duration. (d) Color map depicting the regions of fundamental mode-locking (25 GHz) from 20°C to 120°C where the SNR>25 dB. (e) Optical spectra (resolution: 0.03 nm, VBW: 200 Hz). (f) 6 dB bandwidth and the corresponding number of comb teeth.
    Fig. 4. Temperature-dependent characteristics of two-section passive QD-MLL with a constant VSA=2  V and Igain of 49, 60, 64.7, 85, 148.5, and 210 mA at 20, 40, 60, 80, 100, and 120°C, respectively. (a) RF spectra (RBW: 1 MHz, VBW: 10 kHz). (b) Zoomed-in RF spectra, as shown in (a). (c) Pulse duration. (d) Color map depicting the regions of fundamental mode-locking (25 GHz) from 20°C to 120°C where the SNR>25  dB. (e) Optical spectra (resolution: 0.03 nm, VBW: 200 Hz). (f) 6 dB bandwidth and the corresponding number of comb teeth.
    (a) Optical comb under bias conditions of Igain=148.5 mA and VSA=−2 V at 100°C. (b) Average RIN for the whole optical comb shown in (a) from 0.5 to 10 GHz.
    Fig. 5. (a) Optical comb under bias conditions of Igain=148.5  mA and VSA=2  V at 100°C. (b) Average RIN for the whole optical comb shown in (a) from 0.5 to 10 GHz.
    Shujie Pan, Jianou Huang, Zichuan Zhou, Zhixin Liu, Lalitha Ponnampalam, Zizhuo Liu, Mingchu Tang, Mu-Chieh Lo, Zizheng Cao, Kenichi Nishi, Keizo Takemasa, Mitsuru Sugawara, Richard Penty, Ian White, Alwyn Seeds, Huiyun Liu, Siming Chen. Quantum dot mode-locked frequency comb with ultra-stable 25.5 GHz spacing between 20°C and 120°C[J]. Photonics Research, 2020, 8(12): 1937
    Download Citation