• Photonics Research
  • Vol. 10, Issue 5, 1297 (2022)
Yujing Li1、2, Shanxiang Zhang1、2, Linghua Wu1、2, Zhongwen Cheng1、2, Zhenhui Zhang1、2, Haohao Wang1、2, Shuxiang Zhao1、2, Mingyang Ren1、2, Sihua Yang1、2, Da Xing1、2、4、*, and Huan Qin1、2、3、5、*
Author Affiliations
  • 1MOE Key Laboratory of Laser Life Science & Institute of Laser Life Science, College of Biophotonics, South China Normal University, Guangzhou 510631, China
  • 2Guangdong Provincial Key Laboratory of Laser Life Science, College of Biophotonics, South China Normal University, Guangzhou 510631, China
  • 3Guangzhou Key Laboratory of Spectral Analysis and Functional Probes, College of Biophotonics, South China Normal University, Guangzhou 510631, China
  • 4e-mail: xingda@scnu.edu.cn
  • 5e-mail: qinghuan@scnu.edu.cn
  • show less
    DOI: 10.1364/PRJ.452968 Cite this Article Set citation alerts
    Yujing Li, Shanxiang Zhang, Linghua Wu, Zhongwen Cheng, Zhenhui Zhang, Haohao Wang, Shuxiang Zhao, Mingyang Ren, Sihua Yang, Da Xing, Huan Qin. Polarization microwave-induced thermoacoustic imaging for quantitative characterization of deep biological tissue microstructures[J]. Photonics Research, 2022, 10(5): 1297 Copy Citation Text show less
    Polarization microwave thermoacoustic imaging (P-MTAI) principles. (a) The schematic of vectorial absorption-based P-MTAI. (b) TA signal amplitude in anisotropic targets as a function of θ. The degree of microwave absorption anisotropy (DOMA), ranging from 0 to 1, was proposed to describe the microscopic anisotropy of a target. (c) The diagram of the P-MTAI imaging system and the polarization imaging mechanisms used in the calculation of DOMA. Acronym meanings are as follows: ORP, optical rotating platform; DAQ, data-acquisition system; AMP, amplifier; UT, ultrasonic transducer.
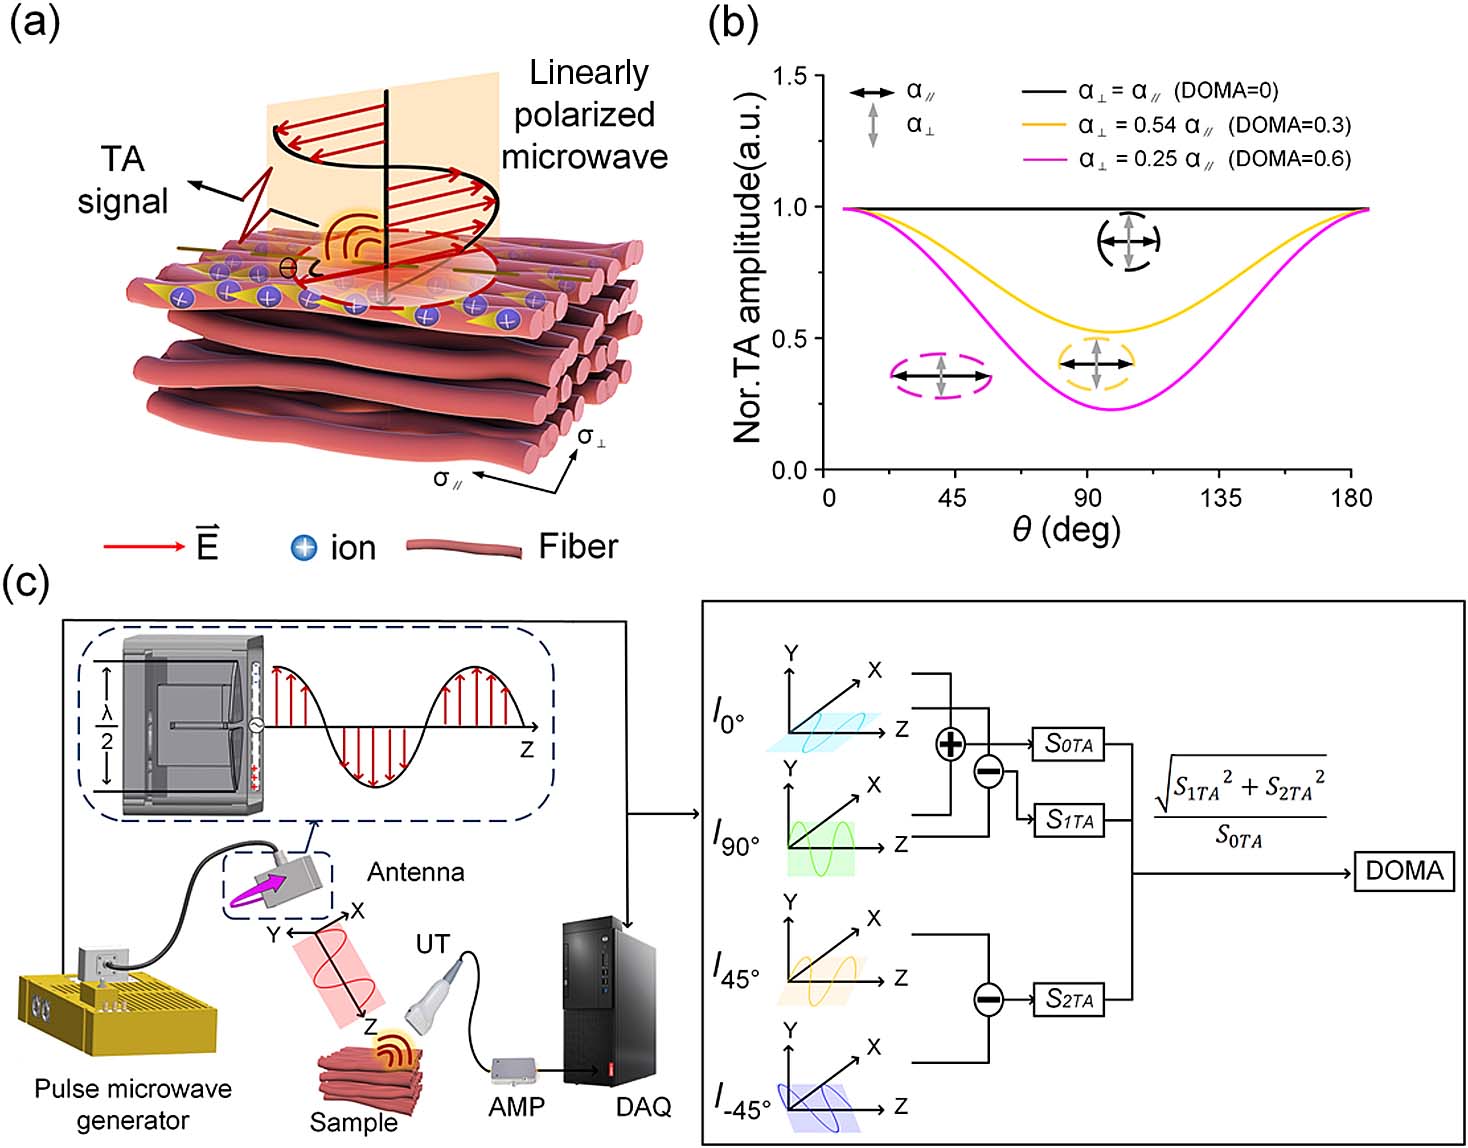
    Fig. 1. Polarization microwave thermoacoustic imaging (P-MTAI) principles. (a) The schematic of vectorial absorption-based P-MTAI. (b) TA signal amplitude in anisotropic targets as a function of θ. The degree of microwave absorption anisotropy (DOMA), ranging from 0 to 1, was proposed to describe the microscopic anisotropy of a target. (c) The diagram of the P-MTAI imaging system and the polarization imaging mechanisms used in the calculation of DOMA. Acronym meanings are as follows: ORP, optical rotating platform; DAQ, data-acquisition system; AMP, amplifier; UT, ultrasonic transducer.
    P-MTAI system. (a) P-MTAI imaging experiment platform. (b) Photograph of the P-MTAI system. (c) Photograph of the linearly polarized microwave antenna.
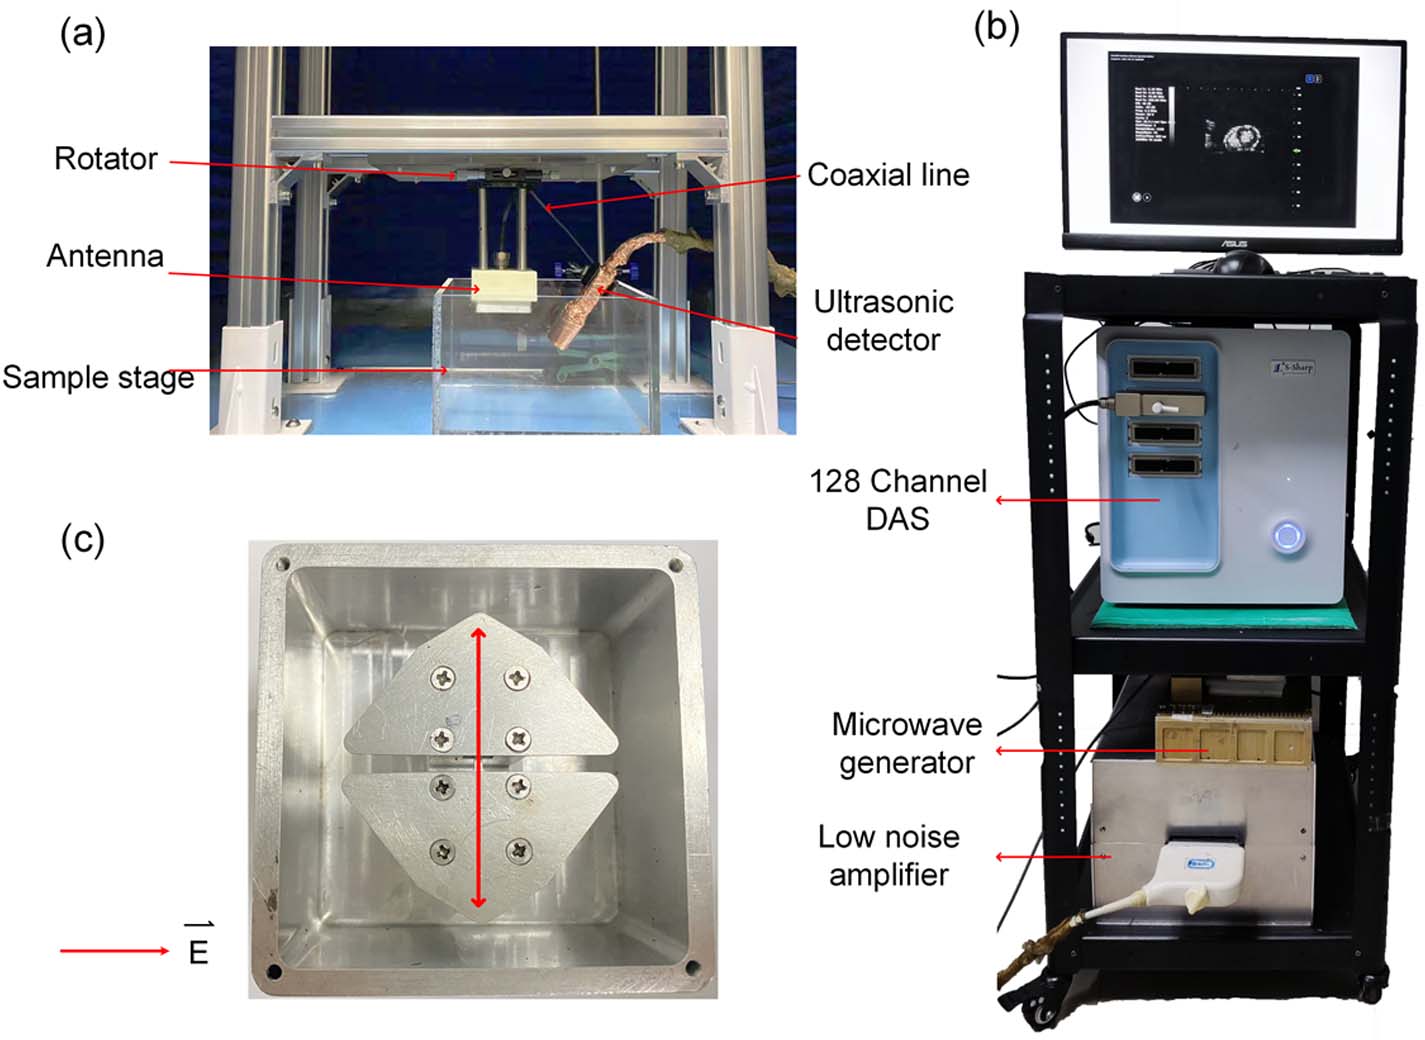
    Fig. 2. P-MTAI system. (a) P-MTAI imaging experiment platform. (b) Photograph of the P-MTAI system. (c) Photograph of the linearly polarized microwave antenna.
    Simulated demonstration of polarization microwave thermoacoustic imaging (P-MTAI). (a) The schematic of sample parameters. The black and gray arrows represent microwave absorption coefficients parallel and perpendicular to the principal axis, respectively. (b) Simulated P-MTAI images of four samples with varying conductivity anisotropies. (c) DOMA images of four samples with varying conductivity anisotropy.
    Fig. 3. Simulated demonstration of polarization microwave thermoacoustic imaging (P-MTAI). (a) The schematic of sample parameters. The black and gray arrows represent microwave absorption coefficients parallel and perpendicular to the principal axis, respectively. (b) Simulated P-MTAI images of four samples with varying conductivity anisotropies. (c) DOMA images of four samples with varying conductivity anisotropy.
    Microwave polarization characterization. (a) Electrical conductivity of graphite absorber in different directions. (b) Schematic of the graphite absorber and the antenna at different angles (θ). (c) Schematic of the electric field inside the sample at different angles (θ). (d) Graphical representation of the relationship between normalized electric-field signal and the angle θ. Normalized data for the experimentally measured electric-field signal are represented by points, and the fitted curve is depicted by a solid line. (e) Depolarization ratios at varying depths.
    Fig. 4. Microwave polarization characterization. (a) Electrical conductivity of graphite absorber in different directions. (b) Schematic of the graphite absorber and the antenna at different angles (θ). (c) Schematic of the electric field inside the sample at different angles (θ). (d) Graphical representation of the relationship between normalized electric-field signal and the angle θ. Normalized data for the experimentally measured electric-field signal are represented by points, and the fitted curve is depicted by a solid line. (e) Depolarization ratios at varying depths.
    Resolution characterization. (a) Schematic of resolution experiment. (b) and (c) FWHM of the Gaussian-fitted lateral and axial profiles of the capillary tube.
    Fig. 5. Resolution characterization. (a) Schematic of resolution experiment. (b) and (c) FWHM of the Gaussian-fitted lateral and axial profiles of the capillary tube.
    Verification of P-MTAI. (a) The photographs of the samples. The dotted black box represents a carbon fiber exhibiting anisotropic conductivity, and the dotted red box represents a carbon powder fiber with isotropic conductivity. (b) P-MTAI images for linearly polarized microwave excitation at varying orientations. (c) Statistical results for the TA signal amplitude shown in (b). (d) The DOMA image corresponding to (b). (e) The photographs of the samples after the application of H&E staining, including skeletal muscle tissue along the longitudinal section and cross section. (f) P-MTAI imaging of longitudinal section muscle and cross-sectional muscle excited by linearly polarized microwaves with differing polarization orientations. (g) Statistical results for the TA signal amplitude shown in (f). (h) The DOMA images corresponding to (f). (i) The P-MTAI images and DOMA images of carbon fibers at different depths. (j) The corresponding DOMA value of (d) at different depths.
    Fig. 6. Verification of P-MTAI. (a) The photographs of the samples. The dotted black box represents a carbon fiber exhibiting anisotropic conductivity, and the dotted red box represents a carbon powder fiber with isotropic conductivity. (b) P-MTAI images for linearly polarized microwave excitation at varying orientations. (c) Statistical results for the TA signal amplitude shown in (b). (d) The DOMA image corresponding to (b). (e) The photographs of the samples after the application of H&E staining, including skeletal muscle tissue along the longitudinal section and cross section. (f) P-MTAI imaging of longitudinal section muscle and cross-sectional muscle excited by linearly polarized microwaves with differing polarization orientations. (g) Statistical results for the TA signal amplitude shown in (f). (h) The DOMA images corresponding to (f). (i) The P-MTAI images and DOMA images of carbon fibers at different depths. (j) The corresponding DOMA value of (d) at different depths.
    Application of P-MTAI. (a) Schematic of experimental device. (b) Schematic of the twisted spiral arrangement exhibited by cardiomyocytes. (c) The statistical analysis corresponding to the four regions of interest shown in (d). (d) Schematic of the heart from wild-type (WT, upper row) and myocardial infarction (MI, bottom row) rabbits wherein the red area marked by 4 is the region exhibiting MI. P-MTAI images of the heart were acquired for both types. The scale bar denotes 100 μm in the main micrographs and 10 mm otherwise. (e) Ultrasound images and corresponding DOMA images. (f) DOMA value statistics collected for different regions of the WT and MI images shown in (e). Each black dot (black circle, 1; black square, 2) represents a DOMA value for each individual WT myocardial region. Each red dot (red circle, 1; red square, 2) represents a DOMA value for each individual MI myocardial region. A total of n=44 independent regions (n=22 WT/n=22 MI) are shown. (g) H&E staining sections corresponding to the four areas in the schematic with a scale bar of 100 μm.
    Fig. 7. Application of P-MTAI. (a) Schematic of experimental device. (b) Schematic of the twisted spiral arrangement exhibited by cardiomyocytes. (c) The statistical analysis corresponding to the four regions of interest shown in (d). (d) Schematic of the heart from wild-type (WT, upper row) and myocardial infarction (MI, bottom row) rabbits wherein the red area marked by 4 is the region exhibiting MI. P-MTAI images of the heart were acquired for both types. The scale bar denotes 100 μm in the main micrographs and 10 mm otherwise. (e) Ultrasound images and corresponding DOMA images. (f) DOMA value statistics collected for different regions of the WT and MI images shown in (e). Each black dot (black circle, 1; black square, 2) represents a DOMA value for each individual WT myocardial region. Each red dot (red circle, 1; red square, 2) represents a DOMA value for each individual MI myocardial region. A total of n=44 independent regions (n=22  WT/n=22MI) are shown. (g) H&E staining sections corresponding to the four areas in the schematic with a scale bar of 100 μm.
    Application of P-MTAI in deep tissue. (a) P-MTAI was applied to a rabbit heart covered with a layer of adipose tissue with a thickness of d=15 mm. (b) The statistical analysis corresponding to the four regions of interest shown in (a). (c) Ultrasound images and corresponding DOMA images. (d) DOMA value statistics acquired for the different WT and MI areas shown in (c). Each black dot (black circle, 1; black square, 2) represents a DOMA value for each individual WT myocardial region. Each red dot (red circle, 1; red square, 2) represents a DOMA value for each individual MI myocardial region. A total of n=40 independent regions (n=20 WT/n=20 MI) are shown.
    Fig. 8. Application of P-MTAI in deep tissue. (a) P-MTAI was applied to a rabbit heart covered with a layer of adipose tissue with a thickness of d=15  mm. (b) The statistical analysis corresponding to the four regions of interest shown in (a). (c) Ultrasound images and corresponding DOMA images. (d) DOMA value statistics acquired for the different WT and MI areas shown in (c). Each black dot (black circle, 1; black square, 2) represents a DOMA value for each individual WT myocardial region. Each red dot (red circle, 1; red square, 2) represents a DOMA value for each individual MI myocardial region. A total of n=40 independent regions (n=20  WT/n=20  MI) are shown.
    Yujing Li, Shanxiang Zhang, Linghua Wu, Zhongwen Cheng, Zhenhui Zhang, Haohao Wang, Shuxiang Zhao, Mingyang Ren, Sihua Yang, Da Xing, Huan Qin. Polarization microwave-induced thermoacoustic imaging for quantitative characterization of deep biological tissue microstructures[J]. Photonics Research, 2022, 10(5): 1297
    Download Citation