
Yujing Li, Shanxiang Zhang, Linghua Wu, Zhongwen Cheng, Zhenhui Zhang, Haohao Wang, Shuxiang Zhao, Mingyang Ren, Sihua Yang, Da Xing, Huan Qin, "Polarization microwave-induced thermoacoustic imaging for quantitative characterization of deep biological tissue microstructures," Photonics Res. 10, 1297 (2022)
- Photonics Research
- Vol. 10, Issue 5, 1297 (2022)
Abstract
1. INTRODUCTION
Polarization optical imaging, which utilizes changes in the vector properties of light as it interacts with a sample, has emerged as a vital tool in biomedical and clinical applications [1–3]. It has proven to be particularly well suited for characterizing microstructures in fibrous constituents (e.g., muscle fibers, collagen, elastin) and effectively detecting modifications in the organization of precancerous tissue, cancerous tissue, and radio-frequency-ablated lesions within the myocardium [4–12]. Polarization imaging has also been extensively utilized for investigating structural damage caused by various pathological conditions in a wide range of clinical frameworks [13,14]. However, the strong optical scattering that occurs in biological tissue across a range of wavelengths has conventionally prevented polarization imaging at depths beyond
Microwave-induced thermoacoustic imaging (MTAI) utilizes pulsed microwaves as an excitation source for generating acoustic signals. Transient heating produces broadband acoustic frequencies on the order of several megahertz in biological tissue due to the absorption of pulsed microwaves by polar molecules or ions, which can then be detected by ultrasound transducers at the tissue surface and reconstructed to form images of the absorbed microwave energy distribution. MTAI combines the high contrast of microwave imaging with the high spatial resolution of ultrasound as an observable contrast exists between diseased tissue and normal tissue due to differences in microwave absorption coefficients [17–19]. In addition, microwave scattering in soft tissue is three orders of magnitude weaker than optical scattering due to the longer wavelengths employed for excitation. As such, MTAI can provide submillimeter resolution at centimeter depths with ultrasound as the information carrier and is a potential candidate for noninvasive disease detection in deep tissues [20–25].
MTAI uses the scalar microwave absorption coefficient as a quantitative imaging target. In practice, this coefficient varies in biological tissues and, thus, emerges as an anisotropic property that depends on both cell morphology and alignment. The basic structural composition of organisms, such as muscle and myocardial fibers, has been shown to exhibit obvious microwave absorption anisotropy [26–28]. For example, normal myocardial tissue is composed of regularly arranged muscle fibers as depicted by the Torrent-Guasp model [29–32]. If myocardial infarction (MI) occurs, the loss of cardiomyocytes (due to necrosis and a rise in collagen) decreases microwave absorption anisotropy and provides an opportunity to image microstructural changes in the tissue [33].
Sign up for Photonics Research TOC. Get the latest issue of Photonics Research delivered right to you!Sign up now
In this paper, a polarization microwave-induced thermoacoustic imaging (P-MTAI) technique is proposed to measure microstructural variations in biological tissues by exploiting absorption anisotropy. A theoretical model is developed and experimentally validated by applying P-MTAI to four linearly polarized microwave samples in various polarization orientations, used as excitation sources to induce thermoacoustic (TA) signals. Reconstructing these signals provided information concerning microscopic variations in the tissue, quantified by the newly proposed degree of microwave absorption anisotropy (DOMA) parameter. The practical feasibility of this approach was tested using vector microwave absorption phantoms, normal cardiac tissue, and tissues exhibiting MI. Results showed that structural variations in tissues were successfully quantified using DOMA. The low scattering characteristics of microwaves and ultrasound in soft tissues allowed P-MTAI to overcome the imaging depth limitations of polarization optical imaging, enabling submillimeter resolution over depths of several centimeters. P-MTAI was also applied to the noninvasive detection of microstructural changes in cardiomyocytes transitioning from ordered to disordered states. With further research, this may provide a potential indicator for predicting the occurrence of MI.
2. MATERIALS AND METHODS
A. Principle
The operating principles underlying P-MTAI can be described as follows. The net polarization angle
Here,
Target heterogeneity was characterized by a new parameter, the DOMA, measured using four linearly polarized microwave excitation sources in different polarization orientations. In the Stokes formalism, the polarization state of a linearly polarized microwave can be described using a Stokes vector [1],
In the Stokes formalism, the degree of linear polarization (DOLP) for a microwave is defined as
Assuming the target to be uniaxial, DOMA for a target is given by
A universal framework for modeling polarization in P-MTAI was developed by representing samples in spatial
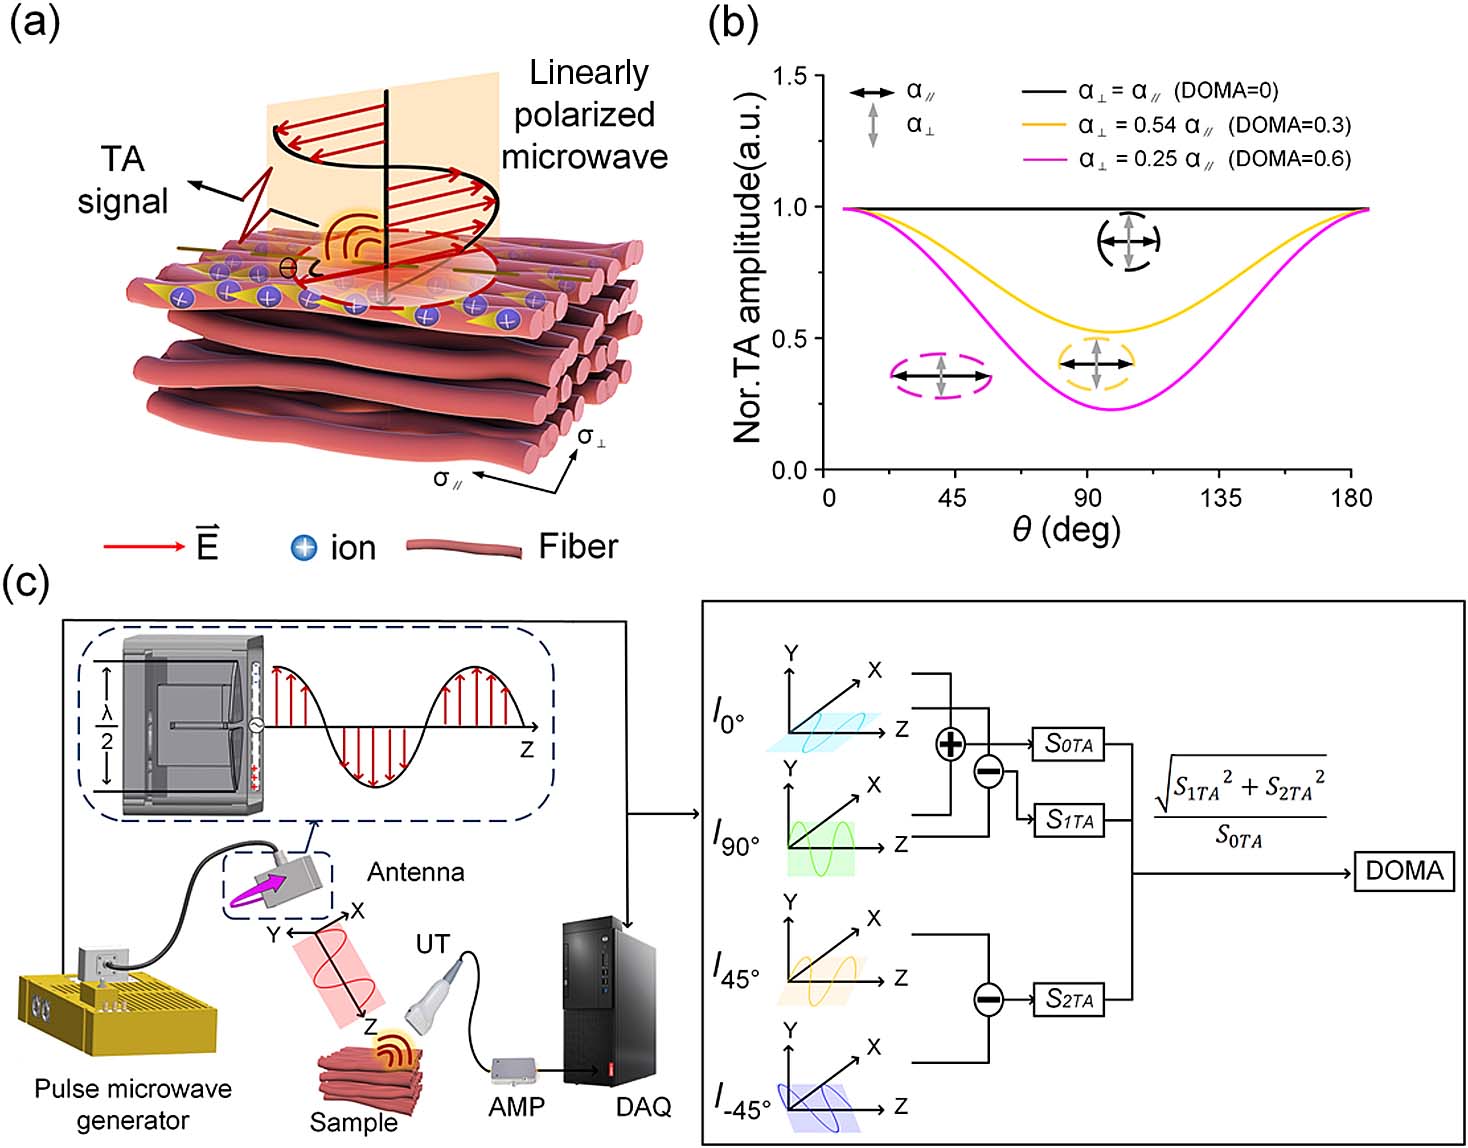
Figure 1.Polarization microwave thermoacoustic imaging (P-MTAI) principles. (a) The schematic of vectorial absorption-based P-MTAI. (b) TA signal amplitude in anisotropic targets as a function of
B. Experimental Setup
A magnetron mode pulse microwave generator (central frequency: 3 GHz, rated voltage: 10 kV, repetition frequency: 10 Hz, peak power: 70 kW) emitted a pulse microwave with a pulse width of 500 ns. Then, a pulsed microwave was coupled to a rotatable half-wave dipole antenna [size:
![]()
Figure 2.P-MTAI system. (a) P-MTAI imaging experiment platform. (b) Photograph of the P-MTAI system. (c) Photograph of the linearly polarized microwave antenna.
To prevent the interference of a microwave to the acquisition system and improve the precision of signal acquisition and image quality, a microwave anechoic chamber was designed. The microwave anechoic chamber was a special room composed of absorbing material (polyurethane absorbing sponge) and a metal shielding body. The appearance of the absorbing material was pyramidal with a cone height of one-microwave wavelength (10 cm). The low noise amplifier was covered with a metal casing to shield electromagnetic (EM) interference [Fig. 2(b)]. A thin metal shielding shell (grounded) between the ultrasonic transducer housing and the internal components can reduce the EM interference. In addition, a copper case was added for the ultrasonic probe, which further improved the EM shielding effect.
C. Animal Handling
This paper complied with the National Institutes of Health Laboratory Animal Center standards for the care and use of laboratory animals. Eight female wild-type (WT) rabbits aged 80 days (2.2–2.5 kg) were used for the study. All experiments were approved by the Ethical Committee for Animal Research at South China Normal University and were conducted following approved guidelines and regulations. Sterile/aseptic techniques were used for all surgical procedures as specified by institutional guidelines. To establish the MI model, we employed a rapid surgical approach that does not require ventilation [36,37]. In brief, rabbits were anesthetized with 2% isoflurane using a vaporized delivery system. Body temperatures were monitored using a thermal probe and maintained at 37°C using a heating pad. In the left side of the chest, a small hole was made, through which the heart protruded out. The left anterior descending artery was ligated using a 6-0 silk suture, after which the heart was immediately placed back into the chest cavity, followed by manual evacuation of air. The wound was closed using sterile medical glue to avoid infection.
3. RESULTS
A. P-MTAI Simulation
The proposed P-MTAI technique was assessed using four polarization directions and four samples with anisotropy values set as shown in Fig. 3(a). The purpose of the P-MTAI technology simulation was to illustrate the rationality of the method, the simulation program was implemented by software MATLAB R2018A. Figure 3(a) shows four simulation media, whose microwave absorption coefficient parameters are set at
![]()
Figure 3.Simulated demonstration of polarization microwave thermoacoustic imaging (P-MTAI). (a) The schematic of sample parameters. The black and gray arrows represent microwave absorption coefficients parallel and perpendicular to the principal axis, respectively. (b) Simulated P-MTAI images of four samples with varying conductivity anisotropies. (c) DOMA images of four samples with varying conductivity anisotropy.
B. Microwave Polarization Characterization
P-MTAI was based on the use of linearly polarized microwaves, which necessitated testing the degree of linearity. First, to study the electric-field distribution of the linearly polarized microwave in the conductivity anisotropic medium, we used software CST to simulate the conductivity anisotropic sample. The conductivity anisotropic sample was set as
![]()
Figure 4.Microwave polarization characterization. (a) Electrical conductivity of graphite absorber in different directions. (b) Schematic of the graphite absorber and the antenna at different angles (
C. P-MTAI Resolution
The imaging capabilities of the proposed P-MTAI system were verified using artificial imaging scenarios in which the corresponding resolution was measured experimentally. The axial and lateral resolutions of the P-MTAI system were measured using a 0.30-mm diameter capillary containing a 5% NaCl solution as a microwave absorber [Fig. 5(a)]. Gaussian fitting was performed along the horizontal and vertical tube profiles, and the full width at half maximum (FWHM) was used to measure the lateral [Fig. 5(b)] and axial resolutions [Fig. 5(c)], yielding values of 0.94 and 0.81 mm, respectively.
![]()
Figure 5.Resolution characterization. (a) Schematic of resolution experiment. (b) and (c) FWHM of the Gaussian-fitted lateral and axial profiles of the capillary tube.
D. Verification of P-MTAI
The viability of the proposed technique was assessed using a carbon fiber bundle exhibiting anisotropic electrical conductivity [38]. The sample was imaged through excitation by a series of linearly polarized microwaves with varying polarization orientations. A photograph of the sample and its corresponding absorption vector distribution is shown in Fig. 6(a). A carbon powder fiber exhibiting isotropic electrical conductivity was also imaged and used as a control sample. The black double arrows in Fig. 6(b) indicate the polarization orientation of the incident microwaves. Results demonstrated that the TA signal amplitude in the carbon fiber samples strongly depended on
![]()
Figure 6.Verification of P-MTAI. (a) The photographs of the samples. The dotted black box represents a carbon fiber exhibiting anisotropic conductivity, and the dotted red box represents a carbon powder fiber with isotropic conductivity. (b) P-MTAI images for linearly polarized microwave excitation at varying orientations. (c) Statistical results for the TA signal amplitude shown in (b). (d) The DOMA image corresponding to (b). (e) The photographs of the samples after the application of H&E staining, including skeletal muscle tissue along the longitudinal section and cross section. (f) P-MTAI imaging of longitudinal section muscle and cross-sectional muscle excited by linearly polarized microwaves with differing polarization orientations. (g) Statistical results for the TA signal amplitude shown in (f). (h) The DOMA images corresponding to (f). (i) The P-MTAI images and DOMA images of carbon fibers at different depths. (j) The corresponding DOMA value of (d) at different depths.
The feasibility of using P-MTAI to directly acquire anisotropy information from biological tissue was also investigated. Skeletal muscle is composed of fibrous cells, individually arranged in the direction of muscle contraction. Electrical conductivity along the length of the fiber is, thus, significantly higher than between the fibers in the extracellular matrix, which is less conductive than individual cells. As such, skeletal muscle exhibits characteristic microwave absorption anisotropy [9]. In addition, the longitudinal conductivity is significantly higher than the transverse conductivity, even when path differences in charge transport are considered. A longitudinal section of skeletal muscle was selected as the biological tissue sample in the experiment, exhibiting distinctive conductivity anisotropy used to test imaging capabilities. A cross section of skeletal muscle exhibiting isotropic conductivity was used as the control. Figure 6(e) shows a photograph of the samples with an applied hematoxylin-eosin (H&E) stain. Corresponding results demonstrated the TA signal amplitude in the longitudinal skeletal muscle depended strongly on
E. Potential P-MTAI Applications
We further tested P-MTAI as a potential diagnostic indicator for predicting the occurrence of MI. Cardiovascular disease is the leading cause of death worldwide, and MI (commonly referred to as a heart attack) is the leading cause of cardiovascular disease-related deaths. Healthy heart tissue is composed primarily of well-organized aligned arrays of cardiomyocytes, arranged helically through the depth of the wall. This includes a right-handed helix in the endocardium, a circumferential helix in the mesocardium, and a left-handed helix in the epicardium [Fig. 7(b)]. Thus, healthy cardiac tissue exhibits electrical conductivity anisotropy, whereas tissue experiencing an MI exhibits isotropy due to an altering of the cardiac cell sequence in the scar tissue of an infarct. As such, P-MTAI could be a useful approach for detecting changes in cardiac tissue microstructure.
![]()
Figure 7.Application of P-MTAI. (a) Schematic of experimental device. (b) Schematic of the twisted spiral arrangement exhibited by cardiomyocytes. (c) The statistical analysis corresponding to the four regions of interest shown in (d). (d) Schematic of the heart from wild-type (WT, upper row) and myocardial infarction (MI, bottom row) rabbits wherein the red area marked by 4 is the region exhibiting MI. P-MTAI images of the heart were acquired for both types. The scale bar denotes 100 μm in the main micrographs and 10 mm otherwise. (e) Ultrasound images and corresponding DOMA images. (f) DOMA value statistics collected for different regions of the WT and MI images shown in (e). Each black dot (black circle, 1; black square, 2) represents a DOMA value for each individual WT myocardial region. Each red dot (red circle, 1; red square, 2) represents a DOMA value for each individual MI myocardial region. A total of
P-MTAI was applied to an isolated heart rabbit model of MI. Healthy rabbit hearts were scanned in the same position using guided ultrasound for comparison purposes. Four regions of interest were then selected from the two groups of images and used for statistical analysis as shown in Fig. 7(c). The black, blue, and purple dots, respectively, represent the three independent normal regions marked in Fig. 7(c). The red dots correspond to the yellow box marked “4” in Fig. 7(d), an area where MI occurred. As hypothesized, this region exhibited the smallest differences in thermoacoustic signal amplitude. The DOMA image in Fig. 7(e) provides an intuitive quantification of the differences shown in Fig. 7(d). DOMA values for the three marked normal areas were
Next, we further tested the capabilities of P-MTAI for identifying MI areas in deep tissues. Actual imaging conditions were synthesized using
![]()
Figure 8.Application of P-MTAI in deep tissue. (a) P-MTAI was applied to a rabbit heart covered with a layer of adipose tissue with a thickness of
4. DISCUSSION
In this paper, targets exhibiting conductivity anisotropy displayed varying microwave absorption as a function of the polarization angle. In addition, isotropic control targets (for which
P-MTAI, which relies on absorption differences for linearly polarized microwaves, is characterized by the clear visualization of lesions and healthy tissue as well as the quantification of DOMA. Images can, thus, be reconstructed by processing TA signals in four polarization directions. The “splitting” effect caused by linear polarization illumination is inevitable. The effect affects DOMA measurement. Previous studies have shown that the image splitting caused by linear polarization illumination could be suppressed by using a circularly polarized illumination [39,40]. However, we cannot use this method to reduce the impact splitting effect on the DOMA measurement because the linear polarization microwave is an indispensable part of the P-MTAI method. It may be desirable to introduce deep learning or artificial intelligence to eliminate splitting distortion.
Currently, P-MTAI requires 1 s to collect data in one polarization direction and, thus, at least, 4 s to reconstruct a full DOMA image. The average normal heart rate for a WT rabbit is between 180 and 250 beats per minute. In humans, the average healthy adult has a heart rate between 60 and 100 beats per minute. As such, the imaging rate for the current P-MTAI system is relatively small relative to the heart rate, but we believe that continuous developments in the technology could lead to higher imaging rates. As a result, this approach has considerable potential for applications in clinical cases.
The MTAI process used in this paper exhibits some limitations in both imaging range and speed. This exploratory paper used 128 line-array scans, highlighting the potential use of P-MTAI as a specific and sensitive tool for detecting underlying diseases, such as MI. Excellent anisotropic quantitative imaging capabilities as well as reproducibility and repeatability have been demonstrated. The quantitative detection of microwave absorption anisotropy in both biological and abiotic samples has been demonstrated. The application of P-MTAI to MI diagnosis in rabbits also confirmed its ability to detect deep tissue diseases. As such, P-MTAI may be able to directly image MI
References
[1] N. Ghosh, I. A. Vitkin. Tissue polarimetry: concepts, challenges, applications, and outlook. J. Biomed. Opt., 16, 110801(2011).
[2] R. Oldenbourg. A new view on polarization microscopy. Nature, 381, 811-812(1996).
[3] N. T. Clancy, S. Arya, J. Qi, D. Stoyanov, G. B. Hanna, D. S. Elson. Polarised stereo endoscope and narrowband detection for minimal access surgery. Biomed. Opt. Express, 5, 4108-4117(2014).
[4] J. Chung, W. Jung, M. J. Hammer-Wilson, P. Wilder-Smith, Z. Chen. Use of polar decomposition for the diagnosis of oral precancer. Appl. Opt., 46, 3038-3045(2007).
[5] W. Wang, L. G. Lim, S. Srivastava, J. S. B. Yan, A. Shabbir, Q. Liu. Roles of linear and circular polarization properties and effect of wavelength choice on differentiation between
[6] J. Jagtap, S. Chandel, N. Das, J. Soni, S. Chatterjee, A. Pradhan, N. Ghosh. Quantitative Mueller matrix fluorescence spectroscopy for precancer detection. Opt. Lett., 39, 243-246(2014).
[7] P. Shukla, A. Pradhan. Mueller decomposition images for cervical tissue: potential for discriminating normal and dysplastic states. Opt. Express, 17, 1600-1609(2009).
[8] A. Pierangelo, A. Nazac, A. Benali, P. Validire, H. Cohen, T. Novikova, B. Ibrahim, S. Manhas, C. Fallet, M. Antonelli, A. Martino. Polarimetric imaging of uterine cervix: a case study. Opt. Express, 21, 14120-14130(2013).
[9] H. He, M. Sun, N. Zeng, E. Du, S. Liu, Y. Guo, J. Wu, Y. He, H. Ma. Mapping local orientation of aligned fibrous scatterers for cancerous tissues using backscattering Mueller matrix imaging. J. Biomed. Opt., 19, 106007(2014).
[10] A. Pierangelo, A. Benali, M. R. Antonelli, T. Novikova, P. Validire, B. Gayet, A. D. Martino.
[11] I. Ahmad, M. Ahmad, K. Khan, S. Ashraf, S. Ahmad, M. Ikram.
[12] A. Pierangelo, S. Manhas, A. Benali, C. Fallet, J. Totobenazara, M. Antonelli, T. Novikova, B. Gayet, A. D. Martino, P. Validire. Multispectral Mueller polarimetric imaging detecting residual cancer and cancer regression after neoadjuvant treatment for colorectal carcinomas. J. Biomed. Opt., 18, 046014(2013).
[13] I. Ahmad, A. Khaliq, M. Iqbal, S. Khan. Mueller matrix polarimetry for characterization of skin tissue samples: a review. Photodiagn. Photodyn. Ther., 30, 101708(2020).
[14] C. He, H. He, J. Chang, B. Chen, H. Ma, M. J. Booth. Polarisation optics for biomedical and clinical applications: a review. Light Sci. Appl., 10, 194(2021).
[15] Z. Zhang, Y. Shi, L. Xiang, D. Xing. Polarized photoacoustic microscopy for vectorial-absorption-based anisotropy detection. Opt. Lett., 43, 5267-5270(2018).
[16] Y. Qu, L. Li, Y. Shen, X. Wei, T. Wong, P. Hu, J. Yao, K. Maslov, L. V. Wang. Dichroism-sensitive photoacoustic computed tomography. Optica, 5, 495-501(2018).
[17] C. Li, M. Pramanik, G. Ku, L. V. Wang. Image distortion in thermoacoustic tomography caused by microwave diffraction. Phys. Rev. E, 77, 031923(2008).
[18] X. Wang, D. R. Bauer, R. Witte, H. Xin. Microwave-induced thermoacoustic imaging model for potential breast cancer detection. IEEE. Trans. Biomed. Eng., 59, 2782-2791(2012).
[19] M. Xu, L. V. Wang. Pulsed-microwave-induced thermoacoustic tomography: filtered backprojection in a circular measurement configuration. Med. Phys., 29, 1661-1669(2002).
[20] Z. Ji, W. Ding, F. Ye, C. Lou, D. Xing. Shape-adapting thermoacoustic imaging system based on flexible multi-element transducer. Appl. Phys. Lett., 107, 094104(2015).
[21] Z. Liu, L. Liu, Y. Xu, L. V. Wang. Transcranial thermoacoustic tomography: a comparison of two imaging algorithms. IEEE Trans. Med. Imaging, 32, 289-294(2012).
[22] D. Razansky, S. Kellnberger, V. Ntziachristos. Near-field radiofrequency thermoacoustic tomography with impulse excitation. Med. Phys., 37, 4602-4607(2010).
[23] X. Wang, D. R. Bauer, J. L. Vollin, D. G. Manzi, R. S. Witte, H. Xin. Impact of microwave pulses on thermoacoustic imaging applications. IEEE Antennas Wireless Propag. Lett., 11, 1634-1637(2012).
[24] X. Wang, R. S. Witte, H. Xin. Thermoacoustic and photoacoustic characterizations of few-layer graphene by pulsed excitations. Appl. Phys. Lett., 108, 143104(2016).
[25] X. Wang, T. Qin, Y. R. S. Qin, , H. Xin. Microwave-induced thermoacoustic communications. IEEE Trans. Microw. Theory, 65, 3369-3378(2017).
[26] F. Gao, Y. Zheng, X. Feng, C. D. Ohl. Thermoacoustic resonance effect and circuit modelling of biological tissue. Appl. Phys. Lett., 102, 063702(2013).
[27] Z. Khalique, P. F. Ferreira, A. D. Scott, S. Nielles-Vallespin, D. N. Firmin, D. J. Pennell. Diffusion tensor cardiovascular magnetic resonance imaging: a clinical perspective. Cardiovasc. Imaging, 13, 1235-1255(2019).
[28] S. B. Rutkove, J. S. Wu, C. Zaidman, K. Kapur, S. Yim, A. Pasternak, L. Madabusi, H. Szelag, T. Harrington, J. Li, A. Pacheck, B. T. Darras. Loss of electrical anisotropy is an unrecognized feature of dystrophic muscle that may serve as a convenient index of disease status. Clin. Neurophysiol., 127, 3546-3551(2016).
[29] M. Akay, D. Miklavčič, N. Pavšelj, F. X. Hart. Electric Properties of Tissues(2006).
[30] L. Qian, J. Wang, L. Jin, B. Song, X. Wu. Effect of ventricular myocardium characteristics on the defibrillation threshold. Technol. Health Care, 26, 241-248(2018).
[31] T. Sui, D. Liu, T. Liu, J. Deng, M. Chen, Y. Xu, Y. Song, H. Ouyang, L. Lai, Z. Li. LMNA-mutated rabbits: a model of premature aging syndrome with muscular dystrophy and dilated cardiomyopathy. Aging Dis., 10, 102(2019).
[32] F. Yang, Q. Sha, R. P. Patterson. A novel electrode placement strategy for low-energy internal cardioversion of atrial fibrillation: a simulation study. Int. J. Cardiol., 158, 149-152(2012).
[33] M. F. Wood, N. Ghosh, M. A. Li, S. H. Wallenburg, R. D. Weisel, B. C. Wilson, R. K. Li, I. A. Vitkin. Polarization birefringence measurements for characterizing the myocardium, including healthy, infarcted, and stem-cell-regenerated tissues. J. Biomed. Opt., 15, 047009(2010).
[34] K. U. Spandana, K. K. Mahato, N. Mazumder. Polarization-resolved Stokes-Mueller imaging: a review of technology and applications. Laser Med. Sci., 34, 1283-1293(2019).
[35] J. C. Lin. A new IEEE standard for safety levels with respect to human exposure to radio-frequency radiation. IEEE Antennas Propag. Mag., 48, 157-159(2006).
[36] A. T. Eckhart, R. T. Balmer, W. A. See, S. K. Patch.
[37] E. Gao, Y. H. Lei, X. Shang, Z. M. Huang, L. Zuo, M. Boucher, Q. Fan, J. K. Chuprun, X. L. Ma, W. J. Koch. A novel and efficient model of coronary artery ligation and myocardial infarction in the mouse. Circ. Res., 107, 1445-1453(2010).
[38] M. F. Haider, P. K. Majumdar, S. Angeloni, K. L. Reifsnider. Nonlinear anisotropic electrical response of carbon fiber-reinforced polymer composites. J. Thermoplast. Compos. Mater., 52, 1017-1032(2018).
[39] Y. He, Y. Shen, X. Feng, C. Liu, L. V. Wang. Homogenizing microwave illumination in thermoacoustic tomography by a linear-tocircular polarizer based on frequency selective surfaces. Appl. Phys. Lett., 111, 063703(2017).
[40] A. Yan, L. Lin, S. Na, C. Liu, L. V. Wang. Large field homogeneous illumination in microwave-induced thermoacoustic tomography based on a quasi-conical spiral antenna. Appl. Phys. Lett., 113, 123701(2018).


Set citation alerts for the article
Please enter your email address

© Copyright 2018-2021 | Chinese Laser Press. All Rights Reserved 沪ICP备15018463号-20