
Jin-qiang CHANG, Ruo-yu ZHANG, Yu-jie PANG, Meng-yun ZHANG, Ya ZHA. Classification of Impurities in Machine-Harvested Seed Cotton Using Hyperspectral Imaging[J]. Spectroscopy and Spectral Analysis, 2021, 41(11): 3552
- Spectroscopy and Spectral Analysis
- Vol. 41, Issue 11, 3552 (2021)
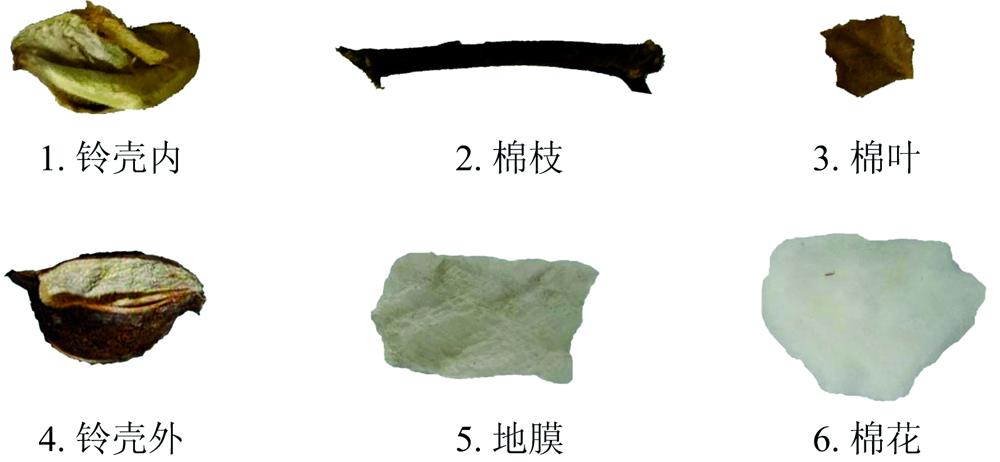
Fig. 1. Machine-harvested seed cotton and main impurities
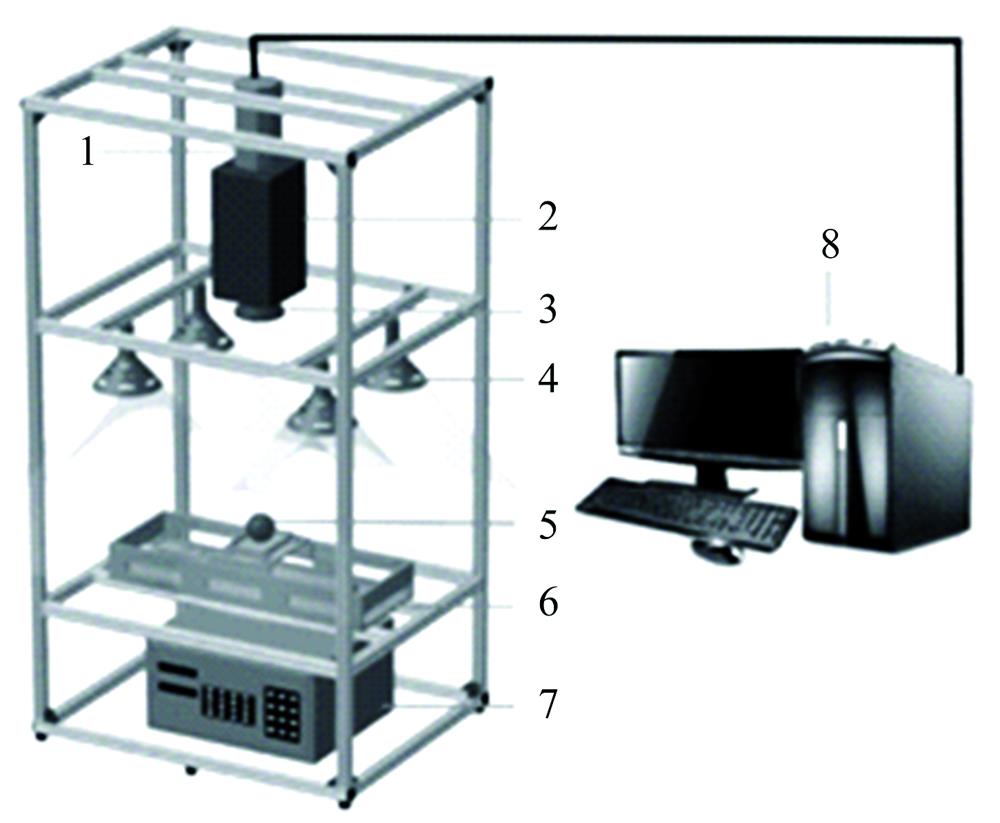
Fig. 2. Hyperspectral imaging system
1: CCD camera; 2: Spectrograph; 3: Lens; 4: Halogen lamps ;5: Sample; 6: Stage; 7: Controller; 8: Computer
1: CCD camera; 2: Spectrograph; 3: Lens; 4: Halogen lamps ;5: Sample; 6: Stage; 7: Controller; 8: Computer
Fig. 3. Mean spectra of mechine-harvested cotton and impurities
Fig. 4. Eigenvalues and cumulative contribution rates of the first 6 principal components
Fig. 5. Scatter clusters of the first 2 principal components
Fig. 6. Scattering clusters of the first 2 variables of LDA
(a): All 6 types of materials; (b): Leaf, bell shell inner, stem
(a): All 6 types of materials; (b): Leaf, bell shell inner, stem
Fig. 7. Parameter optimization results of SVM model
Fig. 8. Parameter optimization results of ANN model
Fig. 9. Pie chart of prediction
Fig. 10. Hyperspectral image classification results in pixel level
(a): Original image; (b): Classification result
(a): Original image; (b): Classification result
|
Table 1. Accuracy and runtime of three classification models


Set citation alerts for the article
Please enter your email address

© Copyright 2018-2021 | Chinese Laser Press. All Rights Reserved 沪ICP备15018463号-20