
Pengfa Chang, Chen Wang, Tao Jiang, Longsheng Wang, Tong Zhao, Hua Gao, Zhiwei Jia, Yuanyuan Guo, Yuncai Wang, Anbang Wang, "Optical scrambler using WGM micro-bottle cavity," Chin. Opt. Lett. 21, 060601 (2023)
- Chinese Optics Letters
- Vol. 21, Issue 6, 060601 (2023)
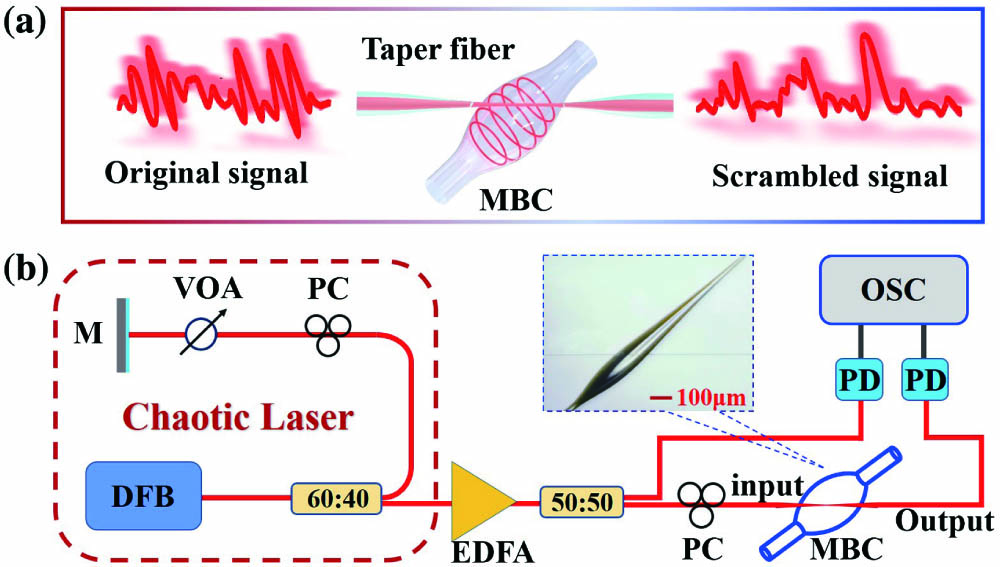
Fig. 1. (a) The schematic diagram of the scrambler using MBC and (b) the experimental setup. DFB, distributed-feedback laser; VOA, optical attenuator; PC, polarization controller; M, mirror; EDFA, erbium-doped fiber amplifier; MBC, micro-bottle cavity; PD, photodetector; OSC, oscilloscope. Inset: the coupling picture of the tapered fiber and the micro-bottle cavity.
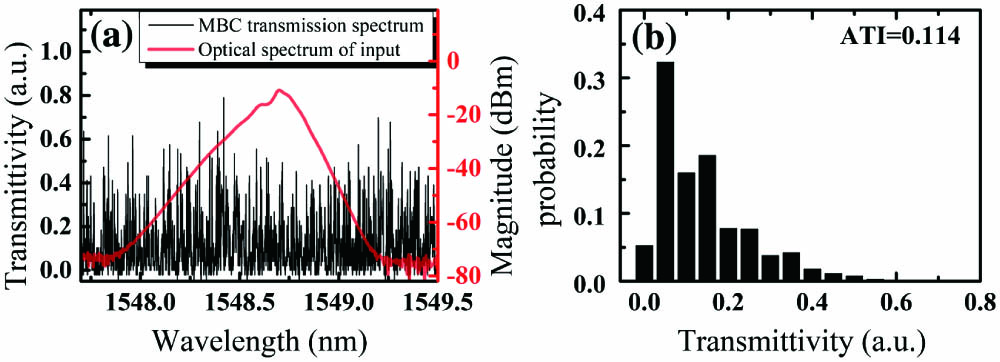
Fig. 2. (a) The transmission spectrum of the MBC (black) and the optical spectrum of the chaotic input (red line), (b) the probability distribution of the transmission intensity corresponding to (a). The ATI is calculated as the quotient of the summation of intensities on the spectrum divided by the number of data points.
Fig. 3. (a) RF spectra, (b) time series, (c) cross correlation, and (d) permutation entropy curves of the input and output of the MBC. The light gray area in (a) represents the background noise. The inset in (c) shows the scatter plot between the input and output, and τ is the feedback delay of the chaotic laser.
Fig. 4. (a1)–(a3) Transmission spectra of the coupling MBC with ATI = 0.963, 0.752, and 0.148. (b1)–(b3) The time series, (c1)–(c3) the cross correlation curves, (d1)–(d3) the RF spectra, and (e1)–(e3) the permutation entropy curves.
Fig. 5. (a) The ATI of the MBC, (b) the input-output correlation CC, and (c) the PE enhancement as a function of the coupling position (d), which is defined as the distance from the coupling point to the thinnest point of the tapered fiber, shown in the inset of (a).


Set citation alerts for the article
Please enter your email address

© Copyright 2018-2021 | Chinese Laser Press. All Rights Reserved 沪ICP备15018463号-20