
Kun Shuai, Xiaofeng Liu, Yuanan Zhao, Keqiang Qiu, Dawei Li, He Gong, Jian Sun, Li Zhou, Youen Jiang, Yaping Dai, Jianda Shao, Zhilin Xia, "Multilayer dielectric grating pillar-removal damage induced by a picosecond laser," High Power Laser Sci. Eng. 10, 06000e42 (2022)
- High Power Laser Science and Engineering
- Vol. 10, Issue 6, 06000e42 (2022)
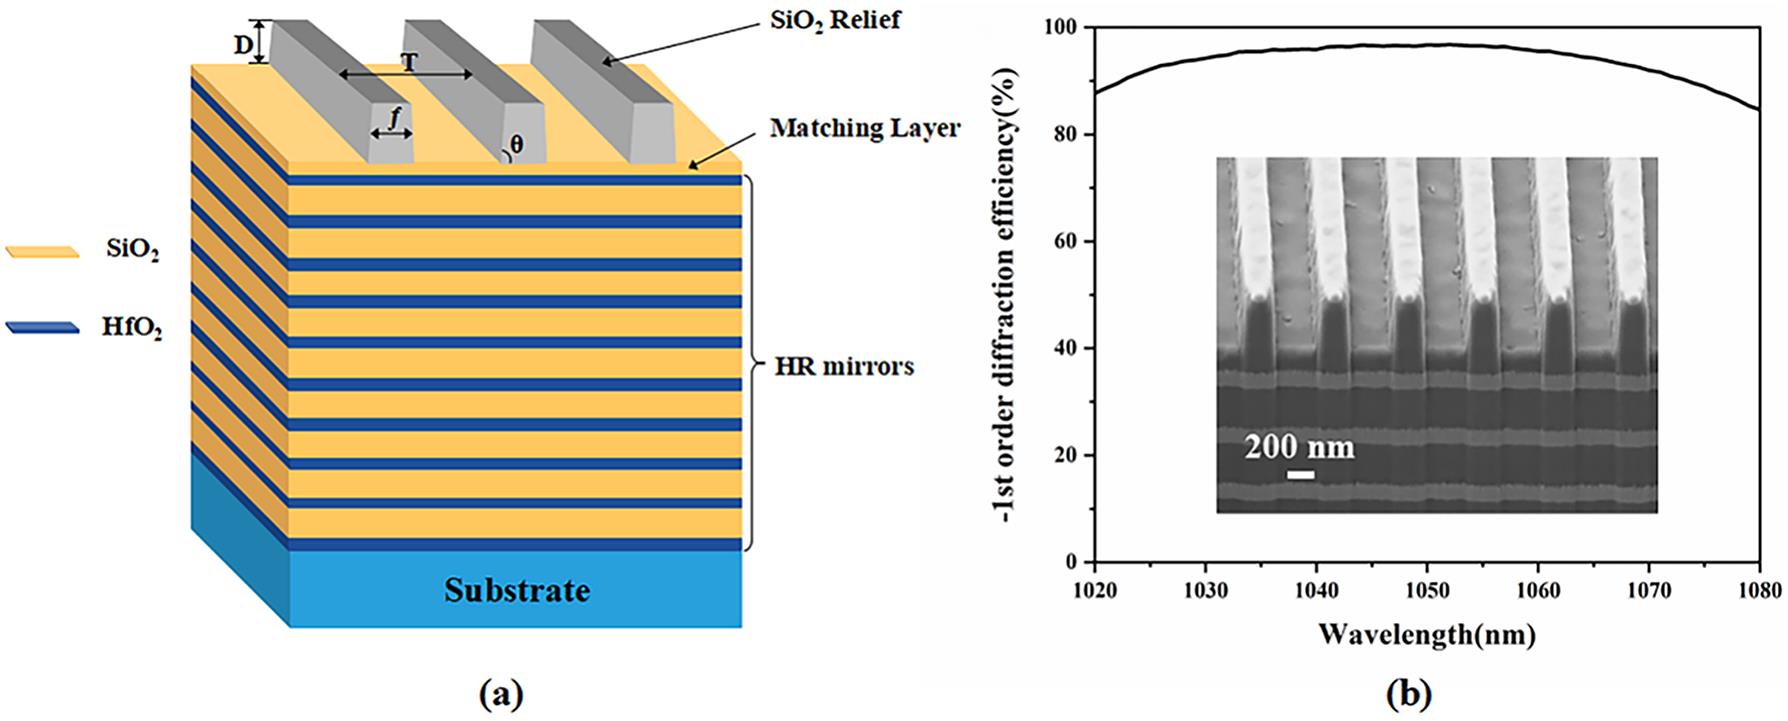
Fig. 1. (a) Schematic representation of the MLDG and (b) the –1st-order diffraction efficiency of the MLDG; the inset shows an SEM image of the pristine cross-sectional morphology of the MLDG. The measured grating period T = 580 nm, mid-waist duty cycle ƒ = 0.38, groove depth D = 415 nm and base angle of the grating pillar θ = 87°.
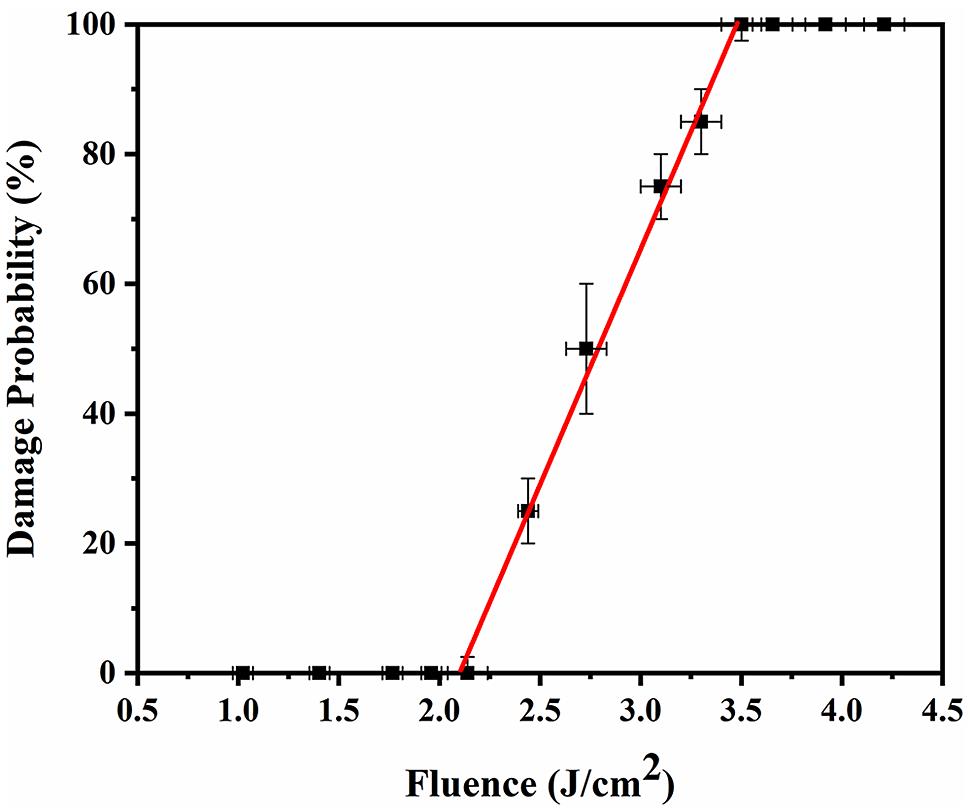
Fig. 2. Damage probability fitting curve of MLDGs under one-on-one test mode. The LIDT of the MLDGs was 2.2 J/cm2 irradiated by an 8.6 ps-pulsed laser with the wavelength of 1053 nm.
Fig. 3. SEM images of typical damage morphology characteristics of the MLDGs. (a) Top-view image of the damage area irradiation by the ps-pulsed laser, and (b)–(d) are the local magnified views of the three black rectangular areas in (a). The test laser irradiated the surface from left to right with a fluence of 3.3 J/cm2.
Fig. 4. Two-dimensional finite-element strain simulation model and calculation results. (a) Schematic representation of the eruptive impact process; the localized eruption of the left-hand pillar induced a rightward impact pressure on the right-hand pillar. (b), (c) Normal stress distributions along the y - and x -axis directions,  and
and  , of the right-hand pillar in (a), respectively. Positive values are tensile stresses and negative values are compressive stresses.
and , of the right-hand pillar in (a), respectively. Positive values are tensile stresses and negative values are compressive stresses. Fig. 5. (a) Schematic representation of the electric field simulation model and (b) laser electric field distribution in MLDGs. The incident laser pulse is centered at 1053 nm, and its pulse width is 8.6 ps.
Fig. 6. Evolution of the electronic density  in the conduction band. The rectangular, circular and triangular shapes represent the sampling point curves on the upper inset image. The calculation time is three times that of the laser pulse width.
in the conduction band. The rectangular, circular and triangular shapes represent the sampling point curves on the upper inset image. The calculation time is three times that of the laser pulse width. Fig. 7. Calculation of the eruptive pressure in the MLDGs. The time step adopted was 10% that the pulse width. (a) Evolution of the eruptive pressure distribution on the right-hand side ridge and (b) distribution of the eruptive pressure in the grating when  The red line in the inset image indicates the sampling boundary for eruptive pressure in (a).
The red line in the inset image indicates the sampling boundary for eruptive pressure in (a).
|
Table 1. Morphological characteristics of the adjacent damaged pillars.
| |||||||||||||||||||||||||||||||||
Table 2. Material parameters used in the calculation[31].


Set citation alerts for the article
Please enter your email address

© Copyright 2018-2021 | Chinese Laser Press. All Rights Reserved 沪ICP备15018463号-20