
Kun Shuai, Xiaofeng Liu, Yuanan Zhao, Keqiang Qiu, Dawei Li, He Gong, Jian Sun, Li Zhou, Youen Jiang, Yaping Dai, Jianda Shao, Zhilin Xia, "Multilayer dielectric grating pillar-removal damage induced by a picosecond laser," High Power Laser Sci. Eng. 10, 06000e42 (2022)
- High Power Laser Science and Engineering
- Vol. 10, Issue 6, 06000e42 (2022)
Abstract
1 Introduction
The advancement in ultra-high-intensity petawatt laser systems[1–4] has promoted the development of extreme physics experiments, laser acceleration devices and biomedical engineering[5–8]. The chirped pulse amplification (CPA) technology proposed by Gérard Mourou and Donna Strickland[9] in 1985 was a breakthrough in ultra-intense pulse laser systems. In the CPA system, it is necessary to utilize the dispersion characteristics of diffraction gratings to stretch and compress the laser pulses in the time domain before and after amplification to avoid the nonlinear effect caused by directly amplifying ultrashort laser pulses[9–11]. The final grating must endure the irradiation of the strongest laser pulse. Therefore, research on the laser damage of pulse compression gratings in short pulses has always been a focus in CPA-based laser systems.
Svakhin et al.[12] first prepared a multilayer dielectric grating (MLDG) by etching relief structures on multilayer dielectric films (MLDFs) composed of alternating high- and low-refractive-index dielectric materials, which theoretically have nearly 100% diffraction efficiency and a higher laser-induced damage threshold (LIDT) because of the negligible intrinsic absorption of dielectric materials. The one-on-one LIDTs of MLDGs exhibited a linear dependence on the maximum electric field intensity (EFI) enhancement in short pulses[13]. Therefore, near-field theoretical optimization of the LIDT improvement is widely used in MLDG fabrication. For pulses with a duration of femtoseconds (fs), the deterministic initial damage occurred on the ridge of the pillars where the maximum EFI enhancement was located[13–15]. This damage was caused by high-energy electrons excited by a strong laser electric field. For picosecond (ps) pulses, in most cases, damage involves the removal of multiple adjacent grating pillar sections[16,17]. It was reported that the optical performance of MLDGs decreases as the damage size increases[18]. However, the dynamic formation process of the final multiple-grating pillar removal remains unclear.
The removal of the grating pillars involves a mechanical damage mechanism that is considered to be caused by the stress waves generated by the confined plasma inside the pillars[19,20]. Gracewski et al.[21] simulated the internal stress waves of the central pillar in the damaged region by loading pressure pulses with Gaussian time dependence. The pressure pulse normal to the mid-point of the side wall of the pillar with a temporal pulse width of 100 ps caused high tensile stress at the bottom of the pillar, whereas a potential damage region was predicted only at the height of the applied pressure for 10 ps, which did not correspond to the phenomenon of pillar separation from its bottom. Hoffman et al.[16] reported the damage characteristic of large-area removal of three adjacent grating pillars, presumably driven by defects in the middle pillar of the three-pillar damage site. Kong et al.[18] proved that the local removal of the grating pillar enhanced the maximum EFI of its adjacent pillars, causing further growth of the damage site under subsequent laser pulse irradiation. However, no studies have revealed the dynamic interaction process between damaged pillars from experiments under a single laser pulse, resulting in an insufficient understanding of the damage to adjacent pillars.
Sign up for High Power Laser Science and Engineering TOC. Get the latest issue of High Power Laser Science and Engineering delivered right to you!Sign up now
In this study, the damage morphologies of MLDGs produced by an 8.6-ps laser pulse are examined to reveal their dynamic formation process. The damage resulted in the removal of adjacent grating pillars at 8.6 ps, which did not involve the destruction of the internal high-reflection (HR) mirror structure when compared with the nano-absorbing defect-induced damage[22] located at the layer interface of the MLDG under nanosecond (ns) laser irradiation. Morphological analysis indicated that the removal of adjacent grating pillars was related to the eruptive pressure of the initially damaged pillar. An interaction process of the adjacent damaged pillars is proposed, in which the high-energy superheated materials at the peak EFI site of the initially damaged pillar erupt first and impinge on its adjacent pillar, forming a fracture from the root of the adjacent pillar. A two-dimensional finite-element strain model is developed to simulate the stress distribution in an impacted pillar. Meanwhile, the ionization rate equations and two-temperature model (TTM) are coupled to calculate the eruptive pressure. The results indicate that the impact pressure of the erupted materials can cause a stress concentration at the root of the adjacent pillar that exceeds its tensile strength, corresponding to its removal morphology.
2 Sample and experimental methods
MLDFs were first obtained by depositing high (HfO2) and low (SiO2) refractivity film materials on fused silica substrates with dimensions of 50 mm × 50 mm × 1.5 mm using electron beam evaporation[22]. Subsequently, the photoresist material was spun on the MLDF, and a photoresist grating relief structure was prepared using the holographic method[23]. The trapezoidal grating structures were transferred to the SiO2 top layer by reactive ion-beam etching[23,24]. A mixture of strong acids and oxidants was used to remove organic residues on the surface of the grating. The MLDGs prepared based on the above methods consist of a bottom-fused silica substrate, internal HR mirrors, top SiO2 matching layer and trapezoidal reliefs, as shown in Figure 1(a). Figure 1(b) shows that the –1st-order diffraction efficiency of the MLDG is greater than 96% at an incident angle of 67° for transverse electric (TE) polarized laser light with a wavelength of 1053 nm. The inset image in Figure 1(b) shows the pristine cross-sectional morphology of the MLDG using scanning electron microscopy (SEM).
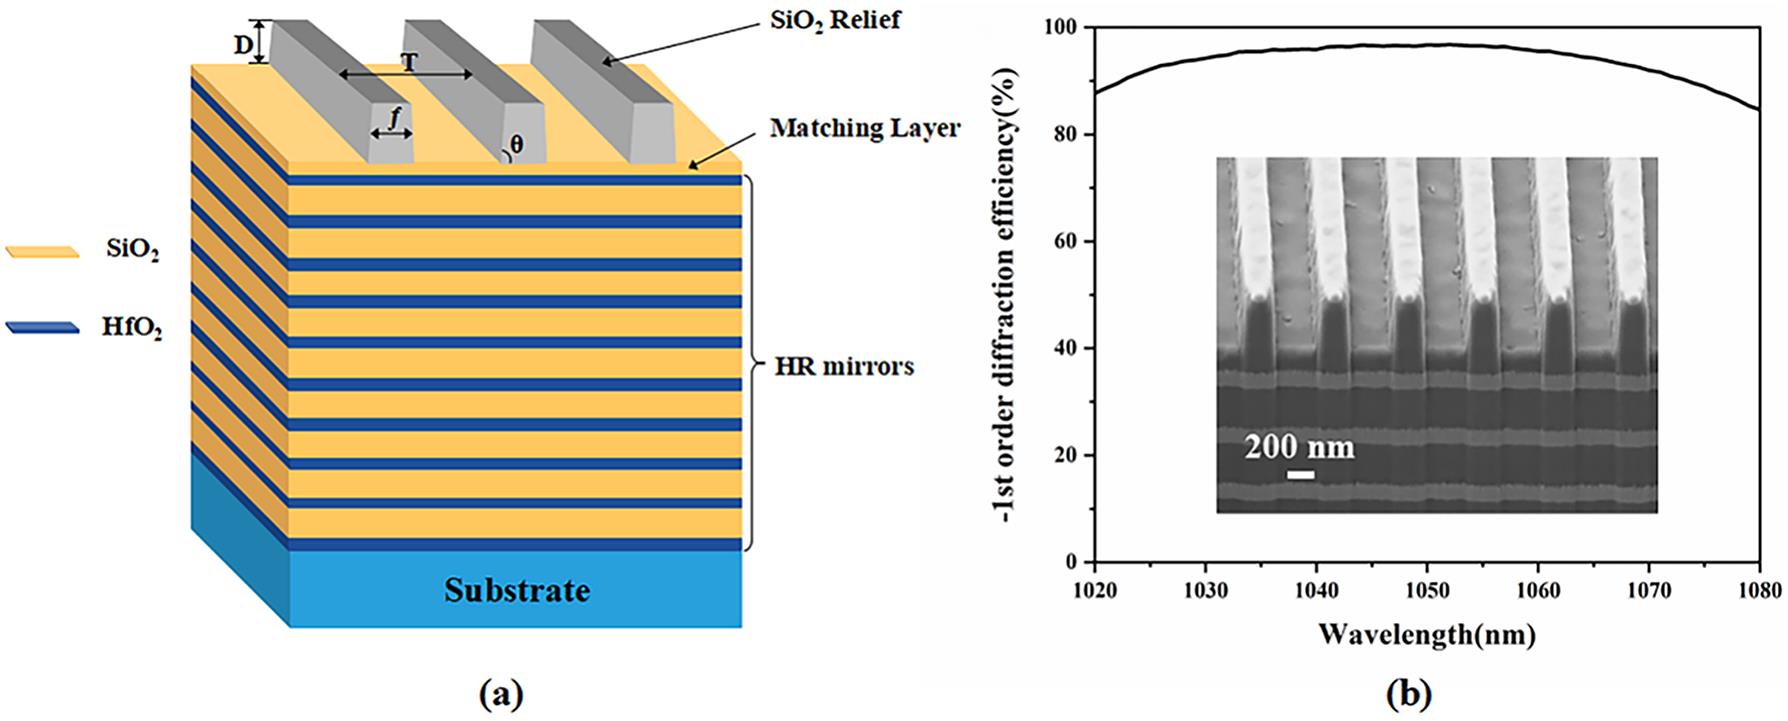
Figure 1.(a) Schematic representation of the MLDG and (b) the –1st-order diffraction efficiency of the MLDG; the inset shows an SEM image of the pristine cross-sectional morphology of the MLDG. The measured grating period
Picosecond-pulsed laser damage experiments[25] were performed using the laser damage test system described by Hao et al.[25]. An incident laser[26] with a central wavelength of 1053 nm, a pulse width of 8.6 ps and a repetition rate of 1 Hz was irradiated on the surface of the grating. The focused near-Gaussian spatial profile beam had a waist diameter of 97.8 μm at normal incidence and the MLDG sample was set on the focal plane. Testing was performed in an air environment at an incident angle of 70° in S-polarization. The one-on-one mode was used for the damage test: each test site was irradiated by a single laser shot and 10 sampling points were exposed to the same fluence pulses during the test. The damage was monitored using a charge-coupled device with a white light source. After the experiments, the damage morphologies were characterized by optical microscopy and SEM (model: Zeiss Auriga). The LIDT of the MLDGs was obtained by damage probability linear extrapolation[27], as shown in Figure 2. The measured LIDT of the MLDG was 2.2 ± 0.1 J/cm2. Note that the laser fluence mentioned in this study is given in the beam normal.
![]()
Figure 2.Damage probability fitting curve of MLDGs under one-on-one test mode. The LIDT of the MLDGs was 2.2 J/cm2 irradiated by an 8.6 ps-pulsed laser with the wavelength of 1053 nm.
In a short-pulse laser damage system, the self-focusing effect in the air caused by the high-peak-power-focused beam should be estimated. The self-focusing effect was defined by evaluating the B-integral[13] at the focus, which can be expressed as follows:
where λ is the laser wavelength, the nonlinear refractive index
3 Damage morphology analysis
Figure 3(a) shows the typical damage morphology of the MLDGs. An incident laser with a fluence of 3.3 J/cm2 irradiated the grating surface from the left-hand side. The overall characteristic of the damage region was the grating pillar removal, which did not involve the destruction of the HR mirror structure because the damage of the internal layers would cause bulging of the grating surface or the formation of ejected pits[17,29,30]. Specifically, the damaged features can be classified as local damage to a single grating pillar and damage to multiple adjacent grating pillars in the horizontal direction.
Figure 3(b) shows the magnified local damage characteristics of a single grating pillar. The three damaged pillars with tiny missing backlight surface ridges in the yellow circles marked ① indicate the initial state of the damage process. This seems to grow into a larger removal that includes the entire top of the pillar, as shown by the yellow circle marked ②. The bottom of the missing region located inside the pillar has a smooth surface, which may be caused by the local melting of the pillar. The pillar material was observed to be overturned upward at the top of the removed area, indicating that the destruction involved a concentrated eruptive process in which the impact of superheated eruptive materials caused the top of the pillar to yield.
![]()
Figure 3.SEM images of typical damage morphology characteristics of the MLDGs. (a) Top-view image of the damage area irradiation by the ps-pulsed laser, and (b)–(d) are the local magnified views of the three black rectangular areas in (a). The test laser irradiated the surface from left to right with a fluence of 3.3 J/cm2.
The consecutive damage morphology of two or more adjacent grating pillars has been widely reported in previous studies[16,17]. However, subtle phenomena between these pillars, revealing the damage process more intuitively, were observed in this study. The typical features are the damage to two adjacent grating pillars, as shown in the damaged area marked ③ in Figures 3(c) and 3(d). Table 1 lists the characteristics of the adjacent damaged pillars. The centers of the damaged pillars were arranged along the horizontal direction. A bright ‘foggy’ region was formed in the grooves of the gratings, starting from the right-hand (backlight) side of the left-hand pillar and extending continuously toward the right. In the left-hand damaged pillar, a 200-nm long fracture was formed on the surface, which was similar to the damaged pillar ②. This indicates that the removal of adjacent grating pillars should be the result of the growth of a single damaged pillar. In particular, the residual pillar materials collapsed toward the left, and cracks were observed on the pillar surface. Moreover, the right-hand damaged pillar fractured from its root, resulting in the removal of the entire pillar and the formation of a long fracture, along the longitudinal direction, of approximately 1 μm.
| Location | Damage characteristics |
|---|---|
| Overall arrangement | Damaged pillars arranged in the horizontal |
| direction | |
| Groove | ‘Foggy’ region that spreads to the right |
| Left-hand pillar | Incomplete collapse toward the left |
| Right-hand pillar | Fracture from the root |
Table 1. Morphological characteristics of the adjacent damaged pillars.
According to the analysis of the morphological features of the adjacent damaged pillars, the formation of the adjacent pillar damage should be related to an eruptive impact process, as shown in Figure 3(c), where the high-energy superheated materials that erupted in the left-hand pillar propagated diffusely and produced an impact pressure on the adjacent pillar, causing the right-hand pillar to break from the root. Heat released during the eruption may have modified the groove and formed the ‘foggy’ region. The collapse of the residual left-hand pillar toward the left direction and the diffusion direction of the ‘foggy’ region further verify this dynamic eruptive process. The left-hand pillar was affected by the eruptive recoil force toward the left, which created a 200-nm long fracture on the surface and caused the pillar materials to collapse to the left. However, this limited recoil force could only achieve incomplete separation of the left-hand pillar. A fracture of approximately 1 μm along the longitudinal direction formed in the right-hand pillar due to the impact of the eruptive materials.
In the following section, this dynamic damage behavior is discussed through the stress field distribution of the right-hand pillar loading by the localized material eruptive pressure from the left-hand pillar.
4 Theoretical calculation and discussion
4.1 Stress field distribution in MLDGs
Figures 3(c) and 3(d) show the impact pressure of the erupted materials acting on the adjacent right-hand grating pillar. A two-dimensional plane strain finite-element model[21] can be used to approximate the stress distribution. The impact pressure causes a uniform boundary load (P0) on the right-hand pillar, as shown in Figure 4(a). The Young’s moduli of the SiO2, HfO2 and substrate used in the calculation are 72, 127 and 73 GPa, respectively. The Poisson’s ratios of the SiO2, HfO2 and substrate are 0.17, 0.18 and 0.17, respectively[31]. For oxide dielectric materials, the tensile strengths are significantly lower than their compressive strengths (e.g., the compressive strength of fused silica is 690–1380 MPa, whereas its tensile strength is 110 MPa[21,32–34]). Therefore, the locations of maximum tensile stress were considered as indicators of the potential mechanical damage.
![]()
Figure 4.Two-dimensional finite-element strain simulation model and calculation results. (a) Schematic representation of the eruptive impact process; the localized eruption of the left-hand pillar induced a rightward impact pressure on the right-hand pillar. (b), (c) Normal stress distributions along the  and
and  , of the right-hand pillar in (a), respectively. Positive values are tensile stresses and negative values are compressive stresses.
In the simulation, we calculated the internal peak stress of the right-hand pillar after applying different initial boundary loads P0. The calculation showed that the pillar would be damaged when the impact pressure applied to the right-hand pillar exceeded 20 MPa. The normal stress distributions inside the right-hand pillar when P0 = 20 MPa are shown in Figures 4(b) and 4(c). The normal stresses in the y- and x-directions are expressed as
The peak normal stress in the y-direction of more than 300 MPa started to exceed the tensile strength of the material when P0 = 20 MPa. Therefore, 20 MPa was chosen as the critical fracture pressure (CFP). By taking 20 MPa as the CFP, the critical eruptive pressure (CEP) from the left-hand pillar required to remove the right-hand pillar was estimated according to the ratio of the damaged cross-sectional areas of the two adjacent pillars. Meanwhile, the impact pressure on the right-hand pillar was uniformly distributed; otherwise, it would cause a larger localized stress concentration and lower CFP of the pillar. The ratio of the fracture lengths of the left- and right-hand damaged pillars along the longitudinal direction were approximately 1/5 and 1/6, respectively, as shown in Figure 3(c). In a homogeneous medium, the diffusion ratios of the localized eruption in different directions should be consistent. Therefore, the ratio of the damaged cross-sectional areas of adjacent pillars was regarded as the square of the ratio of their longitudinal fracture lengths and the diffusion ratio was approximately 1/36 to 1/25; the CEP of the left-hand pillar can be considered to be approximately 500–720 MPa since the CFP was 20 MPa.
4.2 Dynamic model of grating materials eruption
The physical process of grating materials eruption can be expressed as follows. Extensive free electrons, excited by the ionization of the grating materials, rapidly absorb laser energy under a strong laser field. Subsequently, the energy is transferred from electrons to lattices owing to electron–phonon scattering, and part of the materials can be heated to melt or even boil. These ionized superheated materials can be considered to be plasma, which causes a rapid increase in the internal pressure. The eruption occurs when the internal pressure exceeds the tensile strength of the material. The eruptive pressure of the plasma can be solved by coupling the following three modules with the time-domain finite-element method: (i) the electric field propagation module for solving Maxwell’s equations; (ii) the dynamic evolution module of the electronic density based on ionization rate equations; and (iii) the plasma eruptive pressure evaluation module.
4.2.1 Electric field distribution in gratings
The electric field distribution was calculated according to Maxwell’s equations:
where
where
Figure 5(a) shows the simulation model of the electric field. The incident light was irradiated from the left-hand side to the grating surface at an incident angle of 70° in S-polarization. Periodic boundaries were used on the left- and right-hand sides of the model to reduce the computation. Figure 5(b) illustrates the EFI distribution in the MLDG. The peaks of the EFI inside the grating are located on the backlight side of the ridge, and a row of strong-field regions is also distributed at the interfaces between SiO2 and HfO2. The uneven distribution of EFI in the grating leads to different ionization rates. In the region with the highest ionization rate, dense plasma forms first and induces damage. The initial damage position cannot be identified based on the EFI distribution only, considering that HfO2 has a lower material band gap than SiO2. Therefore, we analyzed the ionization process of the materials.
![]()
Figure 5.(a) Schematic representation of the electric field simulation model and (b) laser electric field distribution in MLDGs. The incident laser pulse is centered at 1053 nm, and its pulse width is 8.6 ps.
4.2.2 Ionization process of grating materials
The electron number density ne of the grating material can be calculated from the ionization rate. The ionization mechanism in the picosecond regime combines field and avalanche ionization. At the early stage of the laser pulse, valence band electrons transition to the conduction band by absorbing photon energy and become initial free electrons (i.e., field ionization dominates the ionization process). Multiphoton absorption can significantly promote the breakdown process when the photon energy band gap of the incident laser is approximately one-third that of the dielectric material[35].
The field ionization rate was calculated using the Keldysh model[36]. Adopting the following parameter
to define multiphoton absorption and tunneling ionization, where
where
Inelastic collisions between energetic electrons and ions lead to avalanche ionization, exponentially increasing the electronic density. The electronic density can be calculated using the following empirical formula[37]:
where
Figure 6 shows the evolution of the electronic density for the grating ridge with the peak EFI and two internal HfO2 layers with a strong EFI. The electronic density greatly increased during the laser irradiation, and the backlight side of the top SiO2 pillar ridge had the maximum electronic density, exceeding 1.6 × 1027 m–3, irradiated by the laser pulse with a fluence of 3.3 J/cm2. Electron recombination and electron–phonon scattering reduced the electronic density after the laser pulse. For the internal strong-field HfO2 layers, although the material band gap of HfO2 is narrower than that of SiO2, its maximum electronic density only reached 6.8 × 1025 m–3 because of the limited EFI. This proves that the initial damage occurred in the pillar rather than in the HfO2 layers, as shown by ① in Figure 3(b).
![]()
Figure 6.Evolution of the electronic density  in the conduction band. The rectangular, circular and triangular shapes represent the sampling point curves on the upper inset image. The calculation time is three times that of the laser pulse width.
4.2.3 Eruptive pressure of the plasma
Free electrons excited by ionization can absorb the energy of the laser field, which is partially used in the eruption process. The eruptive pressure
where
where
where
TTM[40] was employed to estimate the temperature evolution of the electron and lattice:
where
| Variables | Materials | |
|---|---|---|
| SiO2 | HfO2 | |
| 1 × 10¹⁰ | ||
| 1.6 × 10⁻¹⁹ | ||
| 9.1 × 10⁻³¹ | ||
| 4 | ||
| 1.42 | 1.86 | |
| 8.5 | 5.5 | |
| 1.4 | 1.1 | |
| 670 | 120 | |
| Density ( | 2200 | 9680 |
Table 2. Material parameters used in the calculation[31].
The evolution of eruptive pressure is shown in Figure 7(a). The laser fluence used in the calculation was 3.3 J/cm2, which is the experimental peak fluence used to obtain the damage morphology in Figure 3. The maximum eruptive pressure during laser irradiation exceeds 7 GPa. Therefore, the adjacent pillar will be fractured under a strong impact pressure. The calculated maximum eruptive pressure is much larger than the CEP calculated in Section 3.1, which may be because of the Gaussian distribution of the beam, resulting in the laser fluence used in the calculation being greater than the practical fluence-induced damage. Figure 7(b) shows that the maximum eruptive pressure in the grating is located at the backlight side ridge of the pillar, which is consistent with the peak EFI site, and damage occurs first in this region.
![]()
Figure 7.Calculation of the eruptive pressure in the MLDGs. The time step adopted was 10% that the pulse width. (a) Evolution of the eruptive pressure distribution on the right-hand side ridge and (b) distribution of the eruptive pressure in the grating when  The red line in the inset image indicates the sampling boundary for eruptive pressure in (a).
In previous studies[29], the nano-absorbing defect located at the first SiO2/HfO2 interface was considered as the damage precursor in the ns-pulsed laser damage of the MLDGs. However, under the ps-pulsed laser, the damage initiation source of the MLDGs was changed due to the peak EFI located in the grating relief. Figure 3(a) shows a random distribution of the damage sites on the grating surface, which is different from the morphology of periodical damaged pillars due to the plasma induced by the periodic distribution of EFI observed by Hocquet et al.[15]. Therefore, besides maximal EFI, shallow defects related with pillars, which are mentioned as type-III damage precursors[42], also contributed to the formation of the adjacent damaged pillars. The presence of maximal EFI and defects may trigger the initially damaged pillars. For the shorter fs-pulsed laser[43,44], the dominance of the EFI was further enhanced, and the influence of the shallow defects disappeared gradually. Particularly for pulses with several tens of fs, the damage was highly deterministic and the initial damage typically located on the back edges of the grating ridges was in correspondence with the maximum EFI.
5 Conclusion
The damage morphology of the MLDG induced by a laser pulse of 8.6 ps included the removal of a single grating pillar and consecutive adjacent grating pillars and did not involve the destruction of the HR structure. A comparative analysis of the two damage morphological characteristics indicated the removal of adjacent pillars was related to an impact process caused by the eruption of localized materials from the left-hand pillar. The collapse of the residual left-hand pillar toward the left-hand direction and the diffusion direction of the ‘foggy’ region further verified this dynamic eruptive process. The backlight side of the pillar ridge with peak EFI had a high ionization rate, which sharply increased the electronic density under laser irradiation. The pressure formed by the expansion of the dense plasma promoted the eruption of the materials in the pillar and caused fractures along the root of the adjacent pillar. However, the limited EFI in the HfO2 layers cannot induce internal damage to the grating, despite the narrower band gap of HfO2 compared with SiO2. This study reveals the interaction process of dynamic eruption-induced damage between grating pillars through an experimental investigation. For future work, improvements in the impact strength of grating pillars, such as more reliable aspect ratios, can be emphasized to limit the occurrence of large-area removal of multiple-grating pillars.
References
[1] C. Danson, D. Hillier, N. Hopps, D. Neely. High Power Laser Sci. Eng., 3(2015).
[2] M. Galletti, P. Oliveira, M. Galimberti, M. Ahmad, G. Archipovaite, N. Booth, E. Dilworth, A. Frackiewicz, T. Winstone, I. Musgrave, C. Hernandez-Gomez. High Power Laser Sci. Eng., 8, e31(2020).
[3] C. Radier, O. Chalus, M. Charbonneau, S. Thambirajah, G. Deschamps, S. David, J. Barbe, E. Etter, G. Matras, S. Ricaud, V. Leroux, C. Richard, F. Lureau, A. Baleanu, R. Banici, A. Gradinariu, C. Caldararu, C. Capiteanu, A. Naziru, B. Diaconescu, V. Iancu, R. Dabu, D. Ursescu, I. Dancus, C. A. Ur, K. A. Tanaka, N. V. Zamfir. High Power Laser Sci. Eng., 10, e21(2022).
[4] Z. Zhang, F. Wu, J. Hu, X. Yang, J. Gui, P. Ji, X. Liu, C. Wang, Y. Liu, X. Lu, Y. Xu, Y. Leng, R. Li, Z. Xu. High Power Laser Sci. Eng, 8(2020).
[5] S. P. Hatchett, C. G. Brown, T. E. Cowan, E. A. Henry, J. S. Johnson, M. H. Key, J. A. Koch, A. B. Langdon, B. F. Lasinski, R. W. Lee, A. J. Mackinnon, D. M. Pennington, M. D. Perry, T. W. Phillips, M. Roth, T. C. Sangster, M. S. Singh, R. A. Snavely, M. A. Stoyer, S. C. Wilks, K. Yasuike. Phys. Plasmas, 7, 2076(2000).
[6] H. Daido, M. Nishiuchi, A. S. Pirozhkov. Rep. Prog. Phys., 75, 056401(2012).
[7] Y. Izawa, N. Miyanaga, J. Kawanaka, K. Yamakawa. J. Opt. Soc. Korea, 12, 178(2008).
[8] J. Hornung, Y. Zobus, P. Boller, C. Brabetz, U. Eisenbarth, T. Kuhl, Z. Major, J. B. Ohland, M. Zepf, B. Zielbauer, V. Bagnoud. High Power Laser Sci. Eng., 8, e24(2020).
[9] D. Strickland, G. Mourou. Opt. Commun., 56, 219(1985).
[10] N. Bonod, J. Neauport. Adv. Opt. Photonics, 8, 156(2016).
[11] C. Zhou. Chin. Opt. Lett., 18, 110502(2020).
[12] A. S. Svakhin, V. A. Sychugov, A. E. Tikhomirov. Quantum Electron., 24, 233(1994).
[13] J. Neauport, E. Lavastre, G. Raze, G. Dupuy, N. Bonod, M. Balas, G. de Villele, J. Flamand, S. Kaladgew, F. Desserouer. Opt. Express, 15, 12508(2007).
[14] L. Xie, J. Zhang, Z. Zhang, B. Ma, T. Li, Z. Wang, X. Cheng. Opt. Express, 29, 2669(2021).
[15] S. Hocquet, J. Neauport, N. Bonod. Appl. Phys. Lett., 99, 061101(2011).
[16] B. N. Hoffman, A. A. Kozlov, N. Liu, H. Huang, J. B. Oliver, A. L. Rigatti, T. J. Kessler, A. A. Shestopalov, S. G. Demos. Opt. Express, 28, 24928(2020).
[17] D. A. Alessi, C. W. Carr, R. P. Hackel, R. A. Negres, K. Stanion, J. E. Fair, D. A. Cross, J. Nissen, R. Luthi, G. Guss, J. A. Britten, W. H. Gourdin, C. Haefner. Opt. Express, 23, 15532(2015).
[18] F. Kong, Y. Jin, H. Guan, S. Liu, J. Wu, Y. Du, H. He. Appl. Opt., 53, 4859(2014).
[19] S. G. Demos, R. A. Negres, R. N. Raman, M. D. Feit, K. R. Manes, A. M. Rubenchik. Optica, 2, 765(2015).
[20] L. Berthe, R. Fabbro, P. Peyre, L. Tollier, E. Bartnicki. J. Appl. Phys., 82, 2826(1997).
[21] S. M. Gracewski, S. Boylan, J. C. Lambropoulos, J. B. Oliver, T. J. Kessler, S. G. Demos. Opt. Express, 26, 18412(2018).
[22] X. Lin, Y. Zhao, X. Liu, D. Li, H. Ma, Y. Shao, K. Qiu, J. Sun, F. Kong, M. Zhu. Proc. SPIE, 11912, 119120O(2021).
[23] K. Qiu, X. Xu, Y. Liu, Y. Hong, S. Fu. Proc. SPIE, 6832, 68322L(2008).
[24] V. Y. Guzhov. J. Opt. Technol., 69, 685(2002).
[25] Y. Hao, M. Sun, S. Shi, X. Pan, Z. Zhu, X. Pang, J. Zhu. Proc. SPIE, 10339, 103390H(2017).
[26] Y. Peng, X. Pan, J. Wang, W. Fan, X. Li. Chin. J. Lasers, 41, 0802009(2014).
[27] J. Becker, A. Bernhardt. Proc. SPIE, 2114, 703(1994).
[28] E. T. J. Nibbering, G. Grillon, M. A. Franco, B. S. Prade, A. Mysyrowicz. J. Opt. Soc. Am. B, 14, 650(1997).
[29] X. Lin, Y. Zhao, X. Liu, D. Li, K. Shuai, H. Ma, Y. Shao, J. Sun, K. Qiu, Y. Cui, Y. Dai, J. Shao. Opt. Mater. Express, 12, 643(2022).
[30] H. Huang, F. Kong, Z. Xia, Y. Jin, L. Li, L. Wang, J. Chen, H. Zhang, Y. Cui, J. Shao. Opt. Mater., 72, 130(2017).
[31] Z. Li, Z. Xia. Appl. Surf. Sci., 494, 977(2019).
[33] G. Brambilla, D. N. Payne. Nano Lett., 9, 831(2009).
[34] K. Zheng, C. Wang, Y.-Q. Cheng, Y. Yue, X. Han, Z. Zhang, Z. Shan, S. X. Mao, M. Ye, Y. Yin, E. Ma. Nat. Commun., 1, 24(2010).
[35] N. Bloembergen. IEEE J. Quantum Electron., 10, 375(1974).
[36] L. V. Keldysh. Sov. Phys. JETP, 20, 1307(1965).
[37] E. G. Gamaly. Phys. Rep., 508, 91(2011).
[38] J. Zhou, Y. Zhang, M. Zhou, S. Yin, J. Yang, H. Wu, D. Guo. Chin. J. Lasers, 32, 135(2005).
[39] Z. Xia, Y. Xue, P. Guo, Z. Li, Z. Fu. Opt. Commun., 282, 3583(2009).
[40] B. Rethfeld, D. S. Ivanov, M. E. Garcia, S. I. Anisimov. J. Phys. D, 50, 193001(2017).
[41] B. C. Stuart, M. D. Feit, S. Herman, A. M. Rubenchik, B. W. Shore, M. D. Perry. Phys. Rev. B, 53, 1749(1996).
[42] A. A. Kozlov, J. C. Lambropoulos, J. B. Oliver, B. N. Hoffman, S. G. Demos. Sci. Rep., 9, 607(2019).
[43] H. Guan, Y. Jin, S. Liu, F. Kong, Y. Du, K. He, K. Yi, J. Shao. Laser Phys., 23, 115301(2013).
[44] P. Poole, S. Trendafilov, G. Shvets, D. Smith, E. Chowdhury. Opt. Express, 21, 26341(2013).


Set citation alerts for the article
Please enter your email address

© Copyright 2018-2021 | Chinese Laser Press. All Rights Reserved 沪ICP备15018463号-20