
Ling Fu, Dingshan Gao. Research on highly dynamic 3D measurement method based on RGB color fringe projection[J]. Journal of the European Optical Society-Rapid Publications, 2023, 19(2): 2023040
Journals >Journal of the European Optical Society-Rapid Publications >Volume 19 >Issue 2 >Page 2023040 > Article
- Journal of the European Optical Society-Rapid Publications
- Vol. 19, Issue 2, 2023040 (2023)
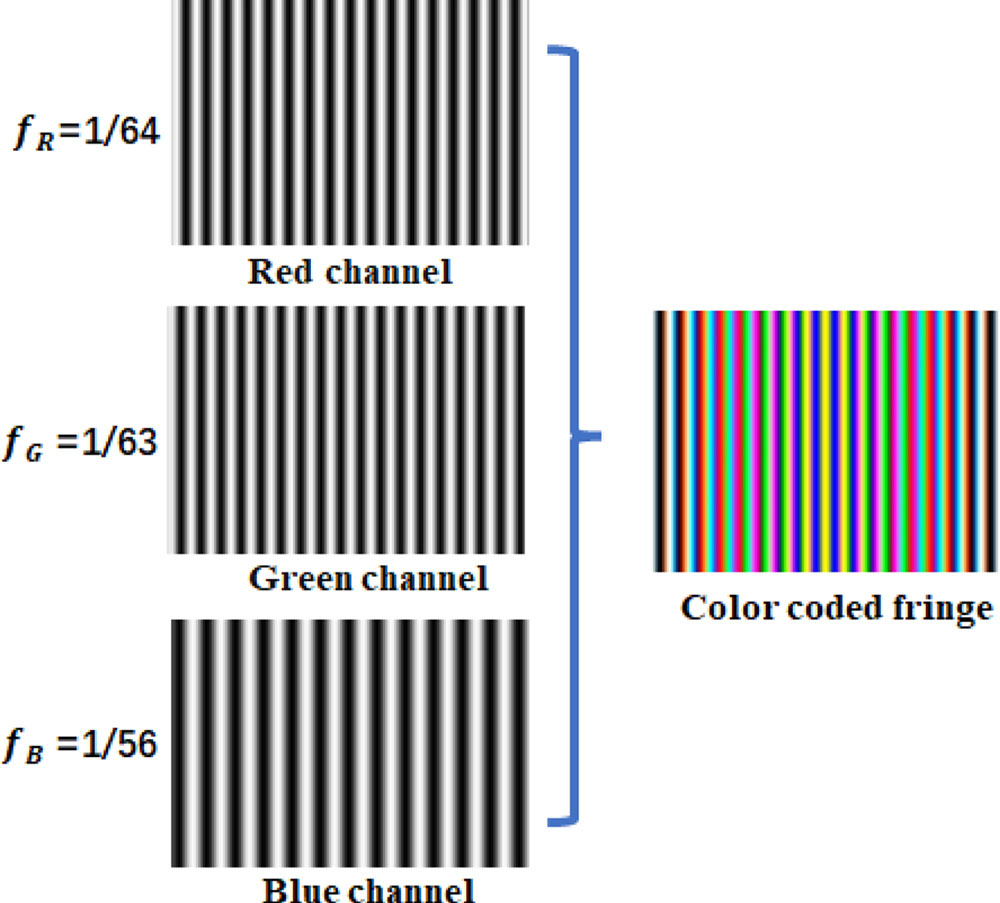
Fig. 1. Schematic diagram of the colored composite stripe generation.
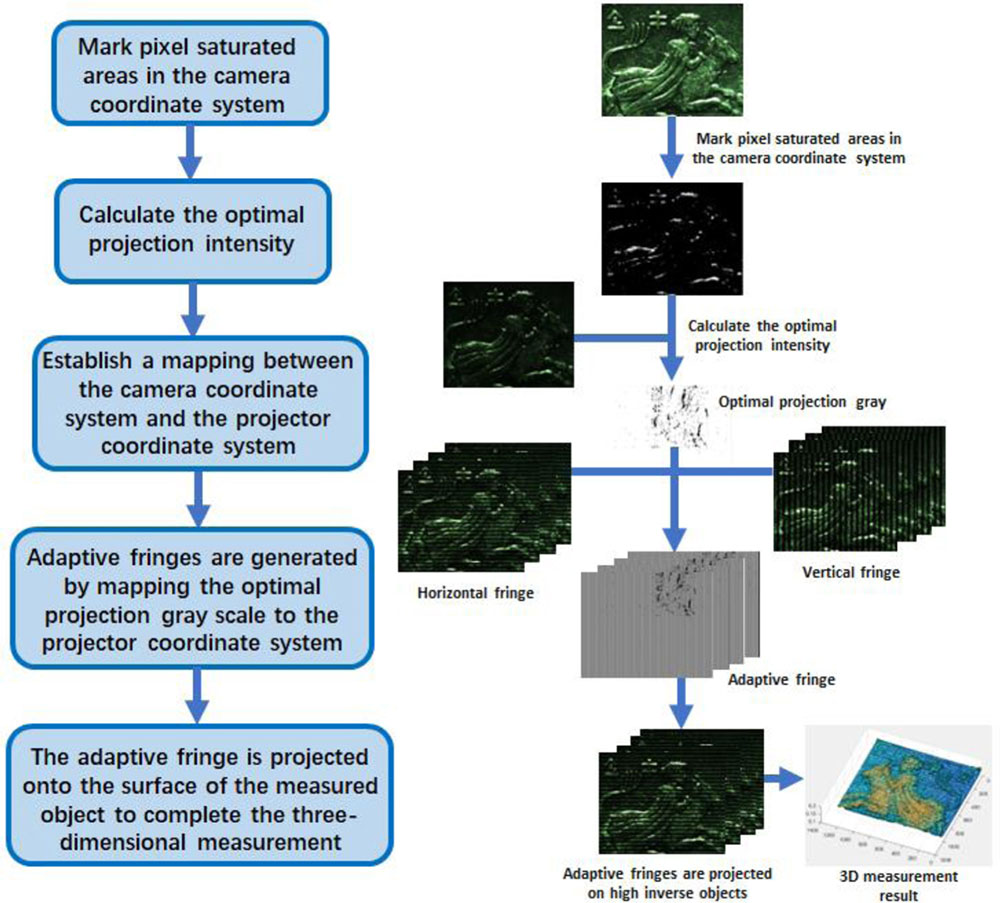
Fig. 2. Flow diagram and experimental flow diagram of adaptive technology.
Fig. 3. Measuring system picture.
Fig. 4. (a) Pure red light is projected onto the plate. (b) Pure green light is projected onto the plate. (c) Pure blue light is projected onto the plate.
Fig. 5. (a) Picture of the measured object. (b) Monochromatic sinusoidal fringes projected onto the measured object.
Fig. 6. Height inverse area of the measured object.
Fig. 7. (a) Colored horizontal stripes are projected onto the measured object (b) colored vertical stripes are projected onto the measured object.
Fig. 8. (a) R channel information of color horizontal stripes. (b) G channel information of color horizontal stripes. (c) B channel information of color horizontal stripes. (d) R channel information of color vertical stripes. (e) G channel information of color vertical stripes. (f) B channel information of color vertical stripes.
Fig. 9. (a) Optimal projected gray level image. (b) Adaptive fringe image with frequency of 1/64. (c) Adaptive fringe image with frequency of 1/63. (d) Adaptive fringe image with frequency of 1/56.
Fig. 10. Generation and projection of adaptive color coded fringe pattern.
Fig. 11. (a) Projective color composite fringe on the measured object. (b) Isolated red channel fringe. (c) Isolated green channel fringe. (d) Isolated blue channel fringe.
Fig. 12. (a) Measurement results of the proposed method. (b) Results of traditional background normalized Fourier transform contouring.
Fig. 13. (a) The color fringe is projected onto the step block. (b) The measurement results of the step block with the proposed method.
|
Table 0. Number of images required of the three methods.
|
Table 0. Measurement values and root mean square error (mm) of the proposed method.

Set citation alerts for the article
Please enter your email address
© Copyright 2018-2021 | Chinese Laser Press. All Rights Reserved 沪ICP备15018463号-20