• Journal of the European Optical Society-Rapid Publications
  • Vol. 19, Issue 2, 2023040 (2023)
Ling Fu1、* and Dingshan Gao2
Author Affiliations
  • 1School of Electronic Information and Communications, Huazhong University of Science and Technology, Wuhan 430074, China
  • 2Wuhan National Laboratory for Optoelectronics & School of Optical and Electronic Information, Huazhong University of Science and Technology, Wuhan 430074, China
  • show less
    DOI: 10.1051/jeos/2023040 Cite this Article
    Ling Fu, Dingshan Gao. Research on highly dynamic 3D measurement method based on RGB color fringe projection[J]. Journal of the European Optical Society-Rapid Publications, 2023, 19(2): 2023040 Copy Citation Text show less

    Abstract

    Metal parts with highly dynamic areas often appear in industrial production measurements. However, if the traditional fringe projection technique is used to project fringe onto the surface of these metal parts, the light energy will be excessively concentrated and the image will be saturated, resulting thus in the loss of fringe information. To effectively address the high reflectivity problem of the object under test in fringe projection, background normalized Fourier transform contouring was combined with adaptive fringe projection in this work and a new method for performing highly dynamic 3D measurements was proposed. To reduce the number of the acquired images by the camera, a monochromatic fringe of different frequencies was put into the RGB channel to make color composite fringe, and then a color camera was used to acquire the deformed color composite fringe map. The images acquired by the color camera were then separated into three channels to obtain three deformed stripe maps. The crosstalk was also removed from these three images, and the 3D shape of the object was reconstructed by carrying out Fourier transform contouring with background normalization. From our experiments, it was demonstrated that the root mean square error of the proposed method can reach 0.191 mm, whereas, unlike the traditional methods, the developed method requires four images.

    1 Introduction

    Structured light-based 3D measurement technology is commonly used in many fields, such as industrial inspection, restoration of cultural relics, and reconstruction of circuit structures because of its high efficiency and accuracy, as well as ease of operation [1]. However, many metal parts in industrial measurements nowadays exhibit a high-dynamic range (HDR) region with a relatively large range of surface reflectance variations. To this end, if traditional fringe projection measurement is performed, the light energy is concentrated, it will greatly reduce the measurement accuracy. Then, image saturation will occur, affecting hence the accuracy and robustness of the 3D measurement results [2]. To solve this problem, various hardware and software-based approaches have been proposed in the literature. As far as the hardware mainly methods are concerned, the problem of the high reflectivity of the subject is solved by adding polarizers, rotating tables to change the projection direction of the projector, and digital micromirrors. On the contrary, the software-based methods mainly include the implementation of multiple exposures and adaptive fringe projection techniques.

    The hardware solution to the high-reflection problem was introduced first. The saturated region of the specular reflection blocks any fringe pattern, resulting in a loss of depth information. Therefore, Salahieh et al. [3] added polarizers to the measurement system and combined them with the exposure time to eliminate the highly reflective region on the subject by choosing different polarization measurements or polarization angles. As a result, better fringe visibility was maintained and thus the subject 3D morphology was effectively measured. In another interesting work, Suresh et al. [4] used a digital micromirror device system to use out-of-focus 1-bit binary patterns for sinusoidal stripe generation to avoid the synchronization requirement between the camera and the projector. In addition, each pattern was acquired twice in one projection cycle, allowing thus two stripes images with different brightness to be obtained, whereas both stripes were combined to solve the high inversion problem on the surface of the subject. Although the hardware-based approach can solve the high-reflection problem to some extent, it comes at the cost of increasing the complexity of the system.

    Next, a software solution to the high-reflection problem was introduced in the literature. Zhang and Yau [5] first proposed to compute the complete 3D morphology of an object by fusing fringe images at many different exposure times, which is called the multiple exposure technique. The authors took advantage of the pixel-by-pixel phase retrieval of the phase shift algorithm to obtain a sequence of fringe images at different exposure times. More specifically, taking advantage of the phenomenon that the brightest fringe image has good fringe quality in the darkest region and the darkest fringe image has good fringe quality in the brightest region, the high-contrast region was replaced by a subsequently acquired low-exposure image. On top of that, a series of improvements, such as the automatic high dynamic projection technique [6], multi-channel fusion technique [7], and time-domain superposition technique have been obtained since then. Nevertheless, the multiple exposure technique [8, 9] requires the utilization of a relatively large number of pictures, which is not favorable for industrial real-time inspection applications. Moreover, the exposure time of the camera needs to be adjusted several times based on personal experience, and there is no exact optimal exposure time. To solve this problem, Zhang [10] later proposed a method that automatically determined the global optimal exposure time for high quality 3D shape measurement by acquiring only the stripe images at one exposure time. Along with the research on multiple exposure techniques, many methods based on modulating the projection intensity to avoid pixel saturation by projecting low grayscale stripe patterns onto bright areas have been also proposed in the literature, i.e., adaptive stripe projection techniques. Liu et al. [6] marked overexposed areas and calculated the optimal projected grayscale by using two white maps with different grayscale, respectively. The orthogonal stripes were projected onto the subject to establish the relationship between the camera coordinate system and the projector coordinate system, and finally, the adaptive stripes were generated and projected onto the surface of the subject to solve the object high-reflection area measurement. However, this approach requires a large number of images to be acquired when matching the camera coordinate system with the projector coordinate system. Meanwhile, many methods based on projection intensity modulation have been also developed. Zhang et al. [11] proposed an adaptive fringe map technique, which can obtain the proper projection intensity by carrying out several iterations. Nonetheless, this iterative approach takes a lot of time. Waddington and Kofman [12] adaptively adjusted the projection fringe map and different intensities to capture the synthetic image of the maximum input gray level (MIGL) to avoid image saturation. But then again, the measurement accuracy in dark areas is still a more difficult problem. Subsequently, the same team [13] proposed an adaptive fringe pattern method to project fringes of appropriate intensity onto the corresponding regions of the object according to the local reflectance of the object. But at the same time, pre-calibration remains a tricky task before the experiment begins. Moreover, Qi et al. [14] proposed an area projection fringe projection technique to remove saturation, but this technique can be only used to measure objects with extremely bright regions. Lin et al. [15] and Chen et al. [16] introduced an improved adaptive fringe pattern method that first marks clusters of saturated regions in an image and then marks fringes to project patterns of lower intensity to these marked regions to avoid pixel saturation. Chen et al. [17] projected orthogonally shifted fringe pattern sequences on the object to create the corresponding mapping, which improved the mapping accuracy.

    Furthermore, the use of color composite stripes to obtain the 3D shape of the subject has been widely studied to reduce the number of image shots and increase the measurement speed [18, 19]. The color projection pattern can also increase the amount of information in a color image taken by a color camera and ensure the uniqueness of the code, and each color channel can carry more phase information. To perform the color composite stripe measurement of dynamic objects, Zhu et al. [20] proposed a color stripe projection 3D measurement method based on multiple confusion matrix (MCM) and look-up table (LUT). Sakashita et al. [21] proposed to collect 3D information using a color coding method that combined both IR and visible channels.

    Along these lines, in this work, an adaptive stripe projection technique based on RGB channels was proposed for conducting HDR 3D measurement of high light objects. The MIGL of the fringe map was locally adjusted according to the reflectance distribution of the object surface, and the fringe map with MIGL 255 was projected onto the unsaturated object area. At the same time, in order to avoid pixel saturation, the fringe map with low MIGL is projected on the saturated area. Compared with the previously reported adaptive fringe projection techniques in the literature [2224], the proposed method only needs one image to calculate the optimal projection gray value, which requires fewer images to be captured in total and can maintain high measurement accuracy. Meanwhile, the background normalized Fourier transform contouring technique was combined with the adaptive technique, and the monochromatic stripes of different frequencies were put into three channels to make color adaptive composite stripes, which reduced the number of images captured by the camera.

    The rest of this work is organized as follows. In Section 2, the principles of the RGB channel-based adaptive fringe projection system are presented. In Section 3, the experiments and accuracy analysis are described, and in Section 4 the full text is summarized.

    2 Measurement principle

    2.1 Color composite stripes

    A color image contains information in three channels: red, green and blue, while a black and white image generally has information in only one of these channels. Unlike monochromatic sine stripes, color composite sine stripes have three channels of information, each of which can contain a monochromatic sine stripe of one frequency. This means that a projector projecting a color composite sine stripe image is equivalent to projecting three monochromatic sine stripe images at the same time, hence greatly reducing projection time and increasing measurement speed.

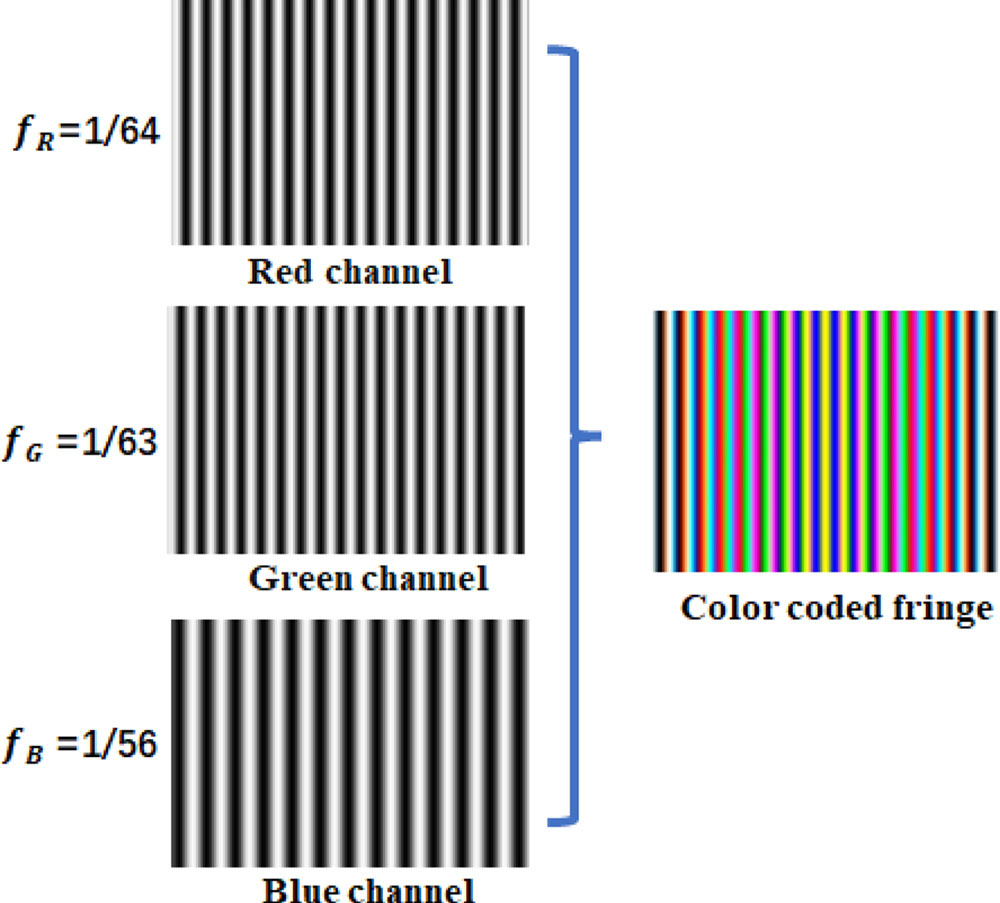
    The color composite stripe proposed in this work used the RGB model, and each color composite stripe map was compounded by three channels, R, G, and B, as is shown in Figure 1. If the phase difference of the sinusoidal stripe map within the three channels is 0, the stripe map within the three channels R, G, and B is represented as follows:IRx,y=ax,y+bx,ycos2πfRx+φx,y,IGx,y=ax,y+bx,ycos2πfGx+φx,y,IBx,y=ax,y+bx,ycos2πfBx+φx,y.

    Schematic diagram of the colored composite stripe generation.

    Figure 1.Schematic diagram of the colored composite stripe generation.

    IR (x, y), IG (x, y), and IB (x, y) are the fringe projection light intensity in the three channels of the projector RGB, a(x, y) denotes the ambient light intensity, b(x, y) refers to the fringe modulation intensity, fR, fG, and fR represent the fringe frequencies in the three channels, whereas the three frequencies used in this work were 1/64, 1/63, and 1/56.

    After generating the color composite stripes, they were recorded into the projector. Then, they were projected onto the surface of the subject by the projector, and the deformed stripes were collected by the color CCD camera. However, this article used the RGB model, and crosstalk issues can certainly occur between the three channels. The problem of stringing originates essentially due to signal coupling that causes interference noise to another channel. The band of color images that appeared at the output image of the RGB image is separated by the image overlap. The RGB channel skewers are the most common issue in the Bayer filter camera, because after using the color difference algorithm, the RGB value assigned by each pixel will be mixed with adjacent pixels, causing hence the color of the neighboring pixels to change the essence. To eliminate the RGB color bruises of the color camera, the color camera should be calibrated [18]. In addition to the correction of the colonies, this method can also solve different problems on the surface of the color objects, and use color stripes to accurately measure color objects.

    2.2 Improved adaptive stripe projection technology

    Adaptive stripe projection is a technology that can measure the three-dimensional contour of high-light objects. Particularly, the best gray value of each pixel that throws a striped pattern can be calculated. The optimal grayscale value was obtained to generate adaptive stripes and inhibit the high-counter-up areas on the surface of the object. The “adaptive measurement” mentioned in this work mainly refers to perform three-dimensional measurements on objects with large surface reflectances on the subject. This technology can calculate the best projection gray value in pixels. The specific steps are as follows: First, the pixel saturation area (i.e., the high anti-regional), was marked by the high anti-regional, which was designed to project the pure white map of 255 to the surface of the measured object and the camera to collect the image. A saturation threshold was set, such as the gray value 250, and then each pixel point gray value of the image was retrieved. If the gray value is greater than 250, the point corresponds to the saturation point, while if the gray value is less than or equal to 250 for normal pixels, the saturated pixels are set to 1, and the normal pixels are bound to 0. The formula is as follows:Mu,v=1I(u,v)>2500I(u,v)250.

    Among them, M(u, v) is a binary matrix that is used to preserve the calculation results, and I(u, v) points to each pixel on the image taken by the camera. After determining the pixel saturation area, the optimal projection intensity of the calculation is required, mainly by building the camera’s intensity Ic and the mapping of the projection strength Ip, where the relationship between them is described in equation (5):Icu,v=ktru,vIp+Ie+ktIa.

    The camera sensitivity k and the exposure time t are camera parameters, Ie indicates the ambient light of the object’s surface reflection, Ia denotes that the ambient light of the camera is directly entered into the camera, and the pixel coordinate of the camera image plane, and the pixel coordinates, and r(u, v) stands for the reflectivity of the measured object in the image coordinate system (u, v). Defining the optimal projection intensity as Io, and the ideal captured intensity as Is, letting Is = Ic, Io = Ip, Io can be calculated as equation (5) to maintain appropriate intensity modulation without saturation in the captured image.Iou,v=Is-kt[ru,vIe-Ia]ktr(u,v).

    In this work, the ideal capture strength Is was set to 250, r(u, v), Ie, and Ia are unknown parameters. Since equation (6) is a diversified equation, a set of equations is needed to calculate the unknown amount. However, in traditional 3D measurement systems, the projection intensity Ip is much higher than Ia and Ie. Therefore, in the structured light three-dimensional measurement system mentioned in this work, the impact of Ia and Ie can be ignored, which can make a(u, v) = ktr(u, v). Therefore, the equation (6) can be simplified to the following expression:Iou,v=Isa(u,v).

    From equation (7), it can be seen that the projection strength of the projector and the capture strength of the camera are linear. To calculate the reflectance a(u, v) of the object, the lower-intensity uniform gray pattern was projected on the object and collected by the camera.Ip' with enough strength was also selected to ensure that the collected image will not appear pixel saturated without pixel saturation. From equation (7), the capture strengthIc'(u,v) can be expressed as follows:Ic'u,v=au,vIp'.

    According to equations (7) and (8), the best projection grayness Io (u, v) can be solved, as shown in equation (9):Iou,v=IsIp'Ic'(u,v).

    After getting the best projection grayscale, it is necessary to locate the corresponding position of all the best projection grayness on the projector coordinate system. The absolute phase of the orthogonal phase of the orthogonal direction can be calculated through the background of the Fourier transformer:Pup,vp=Vφv(uc,vc)2πT+V2Vφh(uc,vc)2πT+H2.

    In equation (10), (uc, vc) is any pixel in the camera coordinate system, V and H represent the width and height of the fringes projected by the projector (in pixel), respectively, φv and φh refer to the continuous phases of the horizontal and vertical fringes respectively, and P(up, vp) denotes the corresponding point of (uc, vc) in the projector coordinate system. The flow diagram and experimental flow of the whole adaptive projection technology are depicted in Figure 2.

    Flow diagram and experimental flow diagram of adaptive technology.

    Figure 2.Flow diagram and experimental flow diagram of adaptive technology.

    In this work, to effectively address the problem of the traditional adaptive fringe projection technology, which needs to project a large number of fringes to establish the mapping relationship between the camera coordinate system and the projector coordinate system, Fourier transform contouring based on background normalization was used to replace the phase-shifting method used by the traditional adaptive technology. Based on the comparative advantages of the background normalization Fourier transform contouring [25], which requires fewer images, the orthogonal phase required by adaptive projection technology was solved and the mapping relationship between projector and camera was established. To further reduce the projection fringe, it was combined with the color composite sinusoidal fringe technique, and the continuous phase of the object can be obtained from only two drawings (one blank picture and one color composite fringe picture with the measured object). As a result, the number of pictures collected by the camera was greatly reduced and the measurement efficiency was significantly improved.

    3 Experiment and precision analysis

    The experimental instruments mainly include a projector and a color CCD camera, the system is displayed in Figure 3.

    Measuring system picture.

    Figure 3.Measuring system picture.

    The traditional adaptive fringe projection technique uses the four-step phase-shift method and the three-frequency heterodyne method to match the camera coordinate system and the projector coordinate system, which requires at least 24 images. However, the proposed method only required three images to complete the step. Two horizontal and vertical color composite fringe images were used to establish the mapping relationship between the camera and the projector, and one blank image was utilized to remove zero frequency by background normalization Fourier transform contouring. The specific experimental operations are as follows.

    Table Infomation Is Not EnableTable Infomation Is Not Enable

    To solve the crosstalk problem of the color camera, the crosstalk matrix of the measurement system must be solved before measuring the object with high reflection. The pure red light, pure green light, and pure blue light were projected on the white board successively. The color camera collected the blank picture and solved the crosstalk matrix, as shown in Figure 4.

    (a) Pure red light is projected onto the plate. (b) Pure green light is projected onto the plate. (c) Pure blue light is projected onto the plate.

    Figure 4.(a) Pure red light is projected onto the plate. (b) Pure green light is projected onto the plate. (c) Pure blue light is projected onto the plate.

    The crosstalk matrix M of the measurement system can be solved as follows:M=0.62580.11680.02570.10300.62000.17080.07550.21690.8653.

    Generally speaking, the crosstalk matrix M can always be used for subsequent correction of color composite fringes as long as the system hardware, such as the camera, projector, and the lens is not changed.

    In this work, a measurement method with fewer images and high efficiency was proposed to solve the problem of high reflectivity of objects. Therefore, some objects with high reflectance areas were selected. As can be seen in Figure 5a, a piece of the object under test can be observed by projecting a pure white figure with a gray value of 255 onto the surface of the object under test. We have to underline that is difficult to measure these high-inverse regions by conventional fringe projection technology. Figure 5b shows the image of the monochromatic sinusoidal fringe projected on the measured object, where it can be seen that the fringe information is seriously missing. If this image was used to reconstruct the three-dimensional topography of the object, it will lead to a large error.

    (a) Picture of the measured object. (b) Monochromatic sinusoidal fringes projected onto the measured object.

    Figure 5.(a) Picture of the measured object. (b) Monochromatic sinusoidal fringes projected onto the measured object.

    An adaptive projection technique was used to suppress the high inverse region on the surface of the measured object. Equation (4) was used to screen the high inverse region. The gray value greater than 250 was defined as the high inverse region. The screening results are as follows

    As illustrated in Figure 6, the white part is the high inverse region of the measured object, while the black part is the normal region. After obtaining the high inverse region of the object, the horizontal and vertical stripes should be cast to establish the mapping relationship between the projector and the camera. The color sinusoidal transverse and vertical composite stripes were then projected onto the surface of the measured object, as shown in Figure 7. The frequencies in the three channels of the color stripes were 1/64, 1/63, and 1/56, respectively.

    Height inverse area of the measured object.

    Figure 6.Height inverse area of the measured object.

    (a) Colored horizontal stripes are projected onto the measured object (b) colored vertical stripes are projected onto the measured object.

    Figure 7.(a) Colored horizontal stripes are projected onto the measured object (b) colored vertical stripes are projected onto the measured object.

    Figures 7a and 7b collected by the color camera were separated for RGB three-channel, and the crosstalk matrix M was used for fringe correction. The results are as shown in Figure 8.

    (a) R channel information of color horizontal stripes. (b) G channel information of color horizontal stripes. (c) B channel information of color horizontal stripes. (d) R channel information of color vertical stripes. (e) G channel information of color vertical stripes. (f) B channel information of color vertical stripes.

    Figure 8.(a) R channel information of color horizontal stripes. (b) G channel information of color horizontal stripes. (c) B channel information of color horizontal stripes. (d) R channel information of color vertical stripes. (e) G channel information of color vertical stripes. (f) B channel information of color vertical stripes.

    In Figure 8, fh* and fv* (* including R, G and B) represent the frequency of the horizontal and vertical stripes separated from the RGB channel respectively, which are 1/64, 1/63, and 1/56. After obtaining horizontal and vertical fringes, blank Figure 5a was added to eliminate zero frequency. The phase φh and φv of the horizontal and vertical fringes can be obtained by using the background normalized Fourier contouring and the three-frequency heterodyne method. By substituting φh and φv into equation (8), the corresponding position of the high inverse region in the camera coordinate system in the projector coordinate system can be solved. The optimal projection intensity was calculated by projecting a pure white image with a lower gray level and collecting pictures with as few high inverse regions on the surface of the measured object. The resulting adaptive stripe pattern is depicted in Figure 9.

    (a) Optimal projected gray level image. (b) Adaptive fringe image with frequency of 1/64. (c) Adaptive fringe image with frequency of 1/63. (d) Adaptive fringe image with frequency of 1/56.

    Figure 9.(a) Optimal projected gray level image. (b) Adaptive fringe image with frequency of 1/64. (c) Adaptive fringe image with frequency of 1/63. (d) Adaptive fringe image with frequency of 1/56.

    The three adaptive fringe patterns in Figure 9 were combined into a color composite coded fringe pattern, and the fringe patterns of the three frequencies were respectively put into the red, green, and blue channels of the color fringe pattern to generate the adaptive color coded fringe pattern. Then, the generated adaptive color coding map was projected onto the surface of the measured object to suppress the high inverse region on its surface. The whole process is displayed in Figure 10.

    Generation and projection of adaptive color coded fringe pattern.

    Figure 10.Generation and projection of adaptive color coded fringe pattern.

    After the color CCD camera acquired the image projected to the measured object by adaptive color coding, it was separated and corrected through three channels. The results are shown in Figure 11.

    (a) Projective color composite fringe on the measured object. (b) Isolated red channel fringe. (c) Isolated green channel fringe. (d) Isolated blue channel fringe.

    Figure 11.(a) Projective color composite fringe on the measured object. (b) Isolated red channel fringe. (c) Isolated green channel fringe. (d) Isolated blue channel fringe.

    After obtaining the separated three-channel fringes of red, green and blue, the background normalized Fourier transform profilometry was used to solve the wrapping phase of the measured object, and the zero-frequency signal was eliminated using pure white, as can be ascertained from Figure 5a. Finally, the three-frequency heterodyne method was used to solve the continuous phase of the measured object, and the morphology of the measured object was obtained, as depicted in Figure 12.

    (a) Measurement results of the proposed method. (b) Results of traditional background normalized Fourier transform contouring.

    Figure 12.(a) Measurement results of the proposed method. (b) Results of traditional background normalized Fourier transform contouring.

    Figure 12a presents the result diagram of the measurement method proposed in this work. The topography of the high inverse region inside the measured object has been completely recovered. The measurement results of the conventional background normalized Fourier transform contouring are shown in Figure 12b, which cannot solve the problem of high inverse region measurement of objects. If the phase shift method was used to solve the wrapping phase, a large number of images needed to be collected by the camera. More specifically, 24 images are needed just to establish the mapping relationship between the camera and the projector, and another 12 images are needed to measure the object after the adaptive fringe is obtained. However, the proposed method in this work only required projecting 4 images (1 blank image, 2 horizontal and vertical color fringe images, and 1 adaptive color fringe image) to obtain the continuous phase of the measured object and solve the high reflection problem of the object.

    To verify the accuracy of the measurement method proposed in this work, a standard block with five steps, each of which is 5 mm in height, was measured. The picture of the color fringe projected on the step block is shown in Figure 13a, and the measurement results are shown in Figure 13b.

    (a) The color fringe is projected onto the step block. (b) The measurement results of the step block with the proposed method.

    Figure 13.(a) The color fringe is projected onto the step block. (b) The measurement results of the step block with the proposed method.

    The step block measurement results and error of the proposed method are presented in Table 1.

    By measuring the step blocks and analysing the root mean square error of each step, it can be seen that the accuracy of the proposed method can reach the value of 0.191 mm.

    Compared with the methods in references [6] and [24], the proposed method is based on Fourier transform profilometry. It has a great advantage in the measurement speed, and the number of pictures required is greatly reduced. Table 2 shows number of images required of the three methods.

    4 Summarize

    In this work, a novel method for measuring objects with high inverse regions was proposed. The method only needs one pure white image of the object, two horizontal and vertical color composite fringe images, as well as one color adaptive fringe image with the object to obtain the complete information of the object with a high inverse region. In striking contrast, the traditional adaptive technology requires many pictures to establish the mapping between the camera coordinate system and projector coordinate system, and the subsequent adaptive fringe measurement of objects requires a total of 36 fringe maps, while the proposed method only needed 4 maps. In the last part of the experiment, it was also proven that the proposed method can recover the information of the high inverse region of the measured object very well, avoid the loss of 3D data caused by overexposure, and remarkably improve the measurement efficiency.

    References

    [1] X. Liu, X. Peng, H. Chen et al. Strategy for automatic and complete three-dimensional optical digitization. Opt. Lett., 37, 3126-8(2012).

    [2] P. Zhang, K. Zhong, L. Zhongwei et al. High dynamic range 3D measurement based on structured light: a review. Journal of Advanced Manufacturing Science and Technology, 1, 2021004–1–9(2021).

    [3] B. Salahieh, Z. Chen, J.J. Rodriguez et al. Multi-polarization fringe projection imaging for high dynamic range objects. Optics Express, 22, 10064-10071(2014).

    [4] V. Suresh, Y. Wang, B. Li. High-dynamic-range 3D shape measurement utilizing the transitioning state of digital micromirror device. Optics and Lasers in Engineering, 107, 176-181(2018).

    [5] S. Zhang, S.-T. Yau. High dynamic range scanning technique [J]. Optical Engineering, 48, 033604-7(2009).

    [6] Y. Liu, Y. Fu, X. Cai et al. A novel high dynamic range 3D measurement method based on adaptive fringe projection technique. Optics and Lasers in Engineering, 128, 106004(2020).

    [7] Y. Liu, Y. Fu, Y. Zhuan et al. High dynamic range real-time 3D measurement based on Fourier transform profilometry. Optics & Laser Technology, 138, 106833(2021).

    [8] S. Feng, Y. Zhang, Q. Chen et al. General solution for high dynamic range three dimensional shape measurement using the fringe projection technique. Optics and Lasers in Engineering, 59, 56-71(2014).

    [9] H. Jiang, H. Zhao, X. Li. High dynamic range fringe acquisition: a novel 3-D scanning technique for high-reflective surfaces. Optics and Lasers in Engineering, 50, 1484-1493(2012).

    [10] S. Zhang. Rapid and automatic optimal exposure control for digital fringe projection technique. Opt. Lasers Eng., 128, 106029(2020).

    [11] C. Zhang, J. Xu, N. Xi et al. A robust surface coding method for optically challenging objects using structured light. IEEE Trans. Autom. Sci. Eng., 11, 775-788(2014).

    [12] C. Waddington, J. Kofman. Analysis of measurement sensitivity to illuminance and fringe-pattern gray levels for fringe-pattern projection adaptive to ambient lighting. Opt. Lasers Eng., 48, 251-6(2010).

    [13] D. Li, J. Kofman. Adaptive fringe-pattern projection for image saturation avoidance in 3D surface-shape measurement. Opt Express, 22, 9887-901(2014).

    [14] Z. Qi, Z. Wang, J. Huang et al. Highlight removal based on the regional-projection fringe projection method. Opt. Eng., 57, 041404(2018).

    [15] H. Lin, J. Gao, Q. Mei et al. Adaptive digital fringe projection technique for high dynamic range three-dimensional shape measurement. Opt. Exp., 24, 7703-18(2016).

    [16] C. Chen, N. Gao, X. Wang et al. Adaptive projection intensity adjustment for avoiding saturation in three-dimensional shape measurement. Opt. Commun., 410, 694-702(2018).

    [17] C. Chen, N. Gao, X. Wang et al. Adaptive pixel-to-pixel projection intensity adjustment for measuring a shiny surface using orthogonal color fringe pattern projection. Meas. Sci. Technol., 29, 055203(2018).

    [18] B. Wei, F. Yanjun, Z. Kejun et al. Rapid 3D measurement of colour objects based on three-channel sinusoidal fringe projection. J. Mod. Opt., 69, 741-749(2022).

    [19] Z. Zhang, C.E. Towers, D.P. Towers. Time efficient color fringe projection system for 3D shape and color using optimum 3-frequency selection. Opt. Exp., 14, 6444-6455(2006).

    [20] Q. Zhu, H. Zhao, C. Zhang et al. Point-to-point coupling and imbalance correction in color fringe projection profilometry based on multi-confusion matrix. Measurement Science and Technology, 32, 115202(2021).

    [21] K. Sakashita, Y. Yagi, R. Sagawa et al. A system for capturing textured 3D shapes based on one-shot grid pattern with multi-band camera and infrared projector, 49-56(2011).

    [22] H. Lin, J. Gao, Q. Mei et al. Three-dimensional shape measurement technique for shiny surfaces by adaptive pixel-wise projection intensity adjustment. Opt. Lasers Eng., 91, 206-15(2017).

    [23] G. Babaie, M. Abolbashari, F. Farahi. Dynamics range enhancement in digital fringe projection technique. Precis. Eng., 39, 243-51(2015).

    [24] H. Lin, J. Gao, Q. Mei et al. Adaptive digital fringe projection technique for high dynamic range three-dimensional shape measurement. Opt. Exp., 24, 7703-7718(2016).

    [25] C. Zuo, T. Tao, S. Feng et al. Micro Fourier transform profilometry (μFTP): 3D shape measurement at 10,000 frames per second. Opt. Lasers Eng., 102, 70-91(2018).

    Ling Fu, Dingshan Gao. Research on highly dynamic 3D measurement method based on RGB color fringe projection[J]. Journal of the European Optical Society-Rapid Publications, 2023, 19(2): 2023040
    Download Citation