• Acta Optica Sinica
  • Vol. 40, Issue 20, 2006001 (2020)
Ou Deng, Binbin Luo*, Decao Wu, Lang Xie, Mingfu Zhao*, Xue Zou, Shenghui Shi, Enhua Liu, and Shanghai Jiang
Author Affiliations
  • Chongqing Key Laboratory of Optical Fiber Sensor and Photoelectric Detection, Chongqing University of Technology, Chongqing 400054, China
  • show less
    DOI: 10.3788/AOS202040.2006001 Cite this Article Set citation alerts
    Ou Deng, Binbin Luo, Decao Wu, Lang Xie, Mingfu Zhao, Xue Zou, Shenghui Shi, Enhua Liu, Shanghai Jiang. Vibration Sensing Characteristics of Reflection-Type Excessively Tilted Fiber Grating Cantilever[J]. Acta Optica Sinica, 2020, 40(20): 2006001 Copy Citation Text show less
    Schematic and equivalent diagrams of bended ExTFG. (a) Schematic diagram of bended ExTFG; (b) equivalent diagram of bended ExTFG
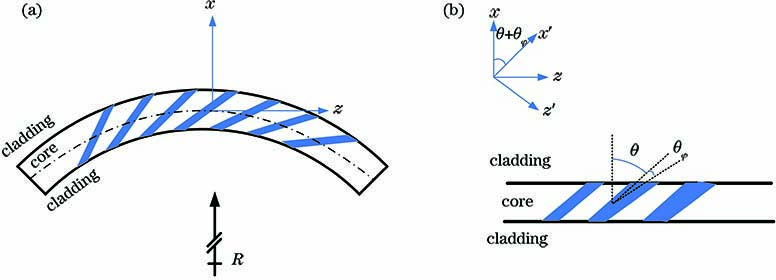
    Fig. 1. Schematic and equivalent diagrams of bended ExTFG. (a) Schematic diagram of bended ExTFG; (b) equivalent diagram of bended ExTFG
    Modal analysis diagrams of cantilever ExTFG based on ANSYS finite element analysis. (a) First-order vibration mode; (b) second-order vibration mode
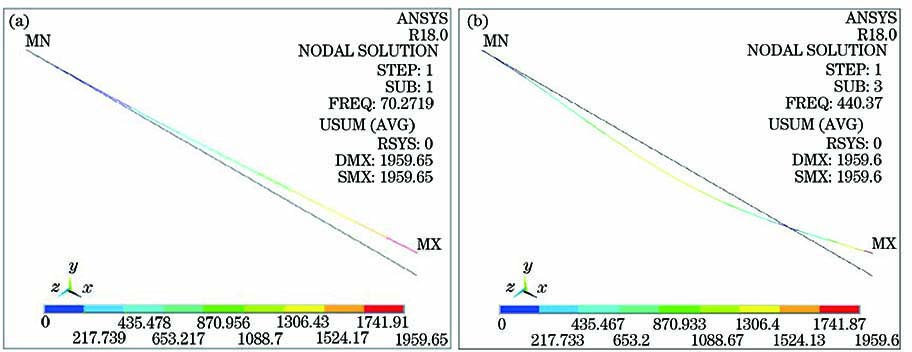
    Fig. 2. Modal analysis diagrams of cantilever ExTFG based on ANSYS finite element analysis. (a) First-order vibration mode; (b) second-order vibration mode
    Frequency response of first-order and second-order vibration modes of ExTFG sensor with different lengths (inset is enlarged view of frequency response)
    Fig. 3. Frequency response of first-order and second-order vibration modes of ExTFG sensor with different lengths (inset is enlarged view of frequency response)
    Light path diagram of reflective ExTFG, and polarization dependence spectrum of reflective ExTFG at C+L band. (a) Light path diagram of reflective ExTFG; (b) polarization dependence spectrum of reflective ExTFG at C+L band
    Fig. 4. Light path diagram of reflective ExTFG, and polarization dependence spectrum of reflective ExTFG at C+L band. (a) Light path diagram of reflective ExTFG; (b) polarization dependence spectrum of reflective ExTFG at C+L band
    Schematic of vibration sensing system and magnified view of ExTFG sensing probe. (a) Schematic of vibration sensing system; (b) magnified view of ExTFG sensing probe
    Fig. 5. Schematic of vibration sensing system and magnified view of ExTFG sensing probe. (a) Schematic of vibration sensing system; (b) magnified view of ExTFG sensing probe
    Amplitude-frequency response of sensor with different lengths at first-order vibration mode. (a) TE mode; (b) TM mode
    Fig. 6. Amplitude-frequency response of sensor with different lengths at first-order vibration mode. (a) TE mode; (b) TM mode
    Amplitude-frequency response of first-order and second-order vibration modes of reflective ExTFG with 3.8 cm length
    Fig. 7. Amplitude-frequency response of first-order and second-order vibration modes of reflective ExTFG with 3.8 cm length
    Response of output amplitude of reflective ExTFG versus input acceleration at different frequencies of 105, 115, and 125 Hz. (a) TE mode; (b) TM mode
    Fig. 8. Response of output amplitude of reflective ExTFG versus input acceleration at different frequencies of 105, 115, and 125 Hz. (a) TE mode; (b) TM mode
    Sensing characteristics of reflective ExTFG when L=2.9 cm. (a) Frequency domain response diagram of 3 dB resonant peak at 115 Hz for TE mode; (b) frequency domain response diagram of 3 dB resonant peak at 105 Hz for TE mode; (c) frequency domain response diagram of 3 dB resonant peak at 115 Hz for TM mode; (d) frequency domain response diagram of 3 dB resonant peak at 105 Hz for TM mode
    Fig. 9. Sensing characteristics of reflective ExTFG when L=2.9 cm. (a) Frequency domain response diagram of 3 dB resonant peak at 115 Hz for TE mode; (b) frequency domain response diagram of 3 dB resonant peak at 105 Hz for TE mode; (c) frequency domain response diagram of 3 dB resonant peak at 115 Hz for TM mode; (d) frequency domain response diagram of 3 dB resonant peak at 105 Hz for TM mode
    Length /cmFirst-order natural frequency /HzSecond-order natural frequency /Hz
    Simulation resultCalculated valueSimulation resultCalculated value
    3.870.2769.79440.37437.36
    2.9120.66119.83756.09750.95
    2.7139.19138.24872.24866.32
    Table 1. Comparison of simulation results and theoretical values of natural frequencies for first-order and second-order vibration modes
    Ou Deng, Binbin Luo, Decao Wu, Lang Xie, Mingfu Zhao, Xue Zou, Shenghui Shi, Enhua Liu, Shanghai Jiang. Vibration Sensing Characteristics of Reflection-Type Excessively Tilted Fiber Grating Cantilever[J]. Acta Optica Sinica, 2020, 40(20): 2006001
    Download Citation