• Acta Optica Sinica
  • Vol. 38, Issue 6, 0612007 (2018)
Song Ye1、2, Yongfeng Sun1、2、3, Zhiwei Li1、2, Hailiang Shi1、2、*, Wei Xiong1、2, Xinqiang Wang1、2, Jiejun Wang1、2, and Wentao Zhang1、2
Author Affiliations
  • 1 Anhui Institute of Optics and Fine Mechanics Chinese Academy of Sciences, Hefei, Anhui 230031, China
  • 1 School of Electronic Engineering and Automation Guilin University of Electronic Technology, Guilin, Guangxi 541004, China
  • 2 Anhui Institute of Optics and Fine Mechanics Chinese Academy of Sciences, Hefei, Anhui 230031, China
  • 2 Guang xi Key Laboratory of Optoelectronic Information Processing Guilin University of Electronic Technology, Guilin, Guangxi, 541004, China
  • 2 Key Laboratory of General Optical Calibration and Characterization Chinese Academyof Sciences, Hefei ,Anhui 230031, China
  • 3 Key Laboratory of General Optical Calibration and Characterization Chinese Academyof Sciences, Hefei ,Anhui 230031, China
  • show less
    DOI: 10.3788/aos201838.0612007 Cite this Article Set citation alerts
    Song Ye, Yongfeng Sun, Zhiwei Li, Hailiang Shi, Wei Xiong, Xinqiang Wang, Jiejun Wang, Wentao Zhang. [J]. Acta Optica Sinica, 2018, 38(6): 0612007 Copy Citation Text show less
    Spectra recovered from interferograms with different orders. (a) The first order response; (b) the second order response; (c) the third order response; (d) the fourth order response
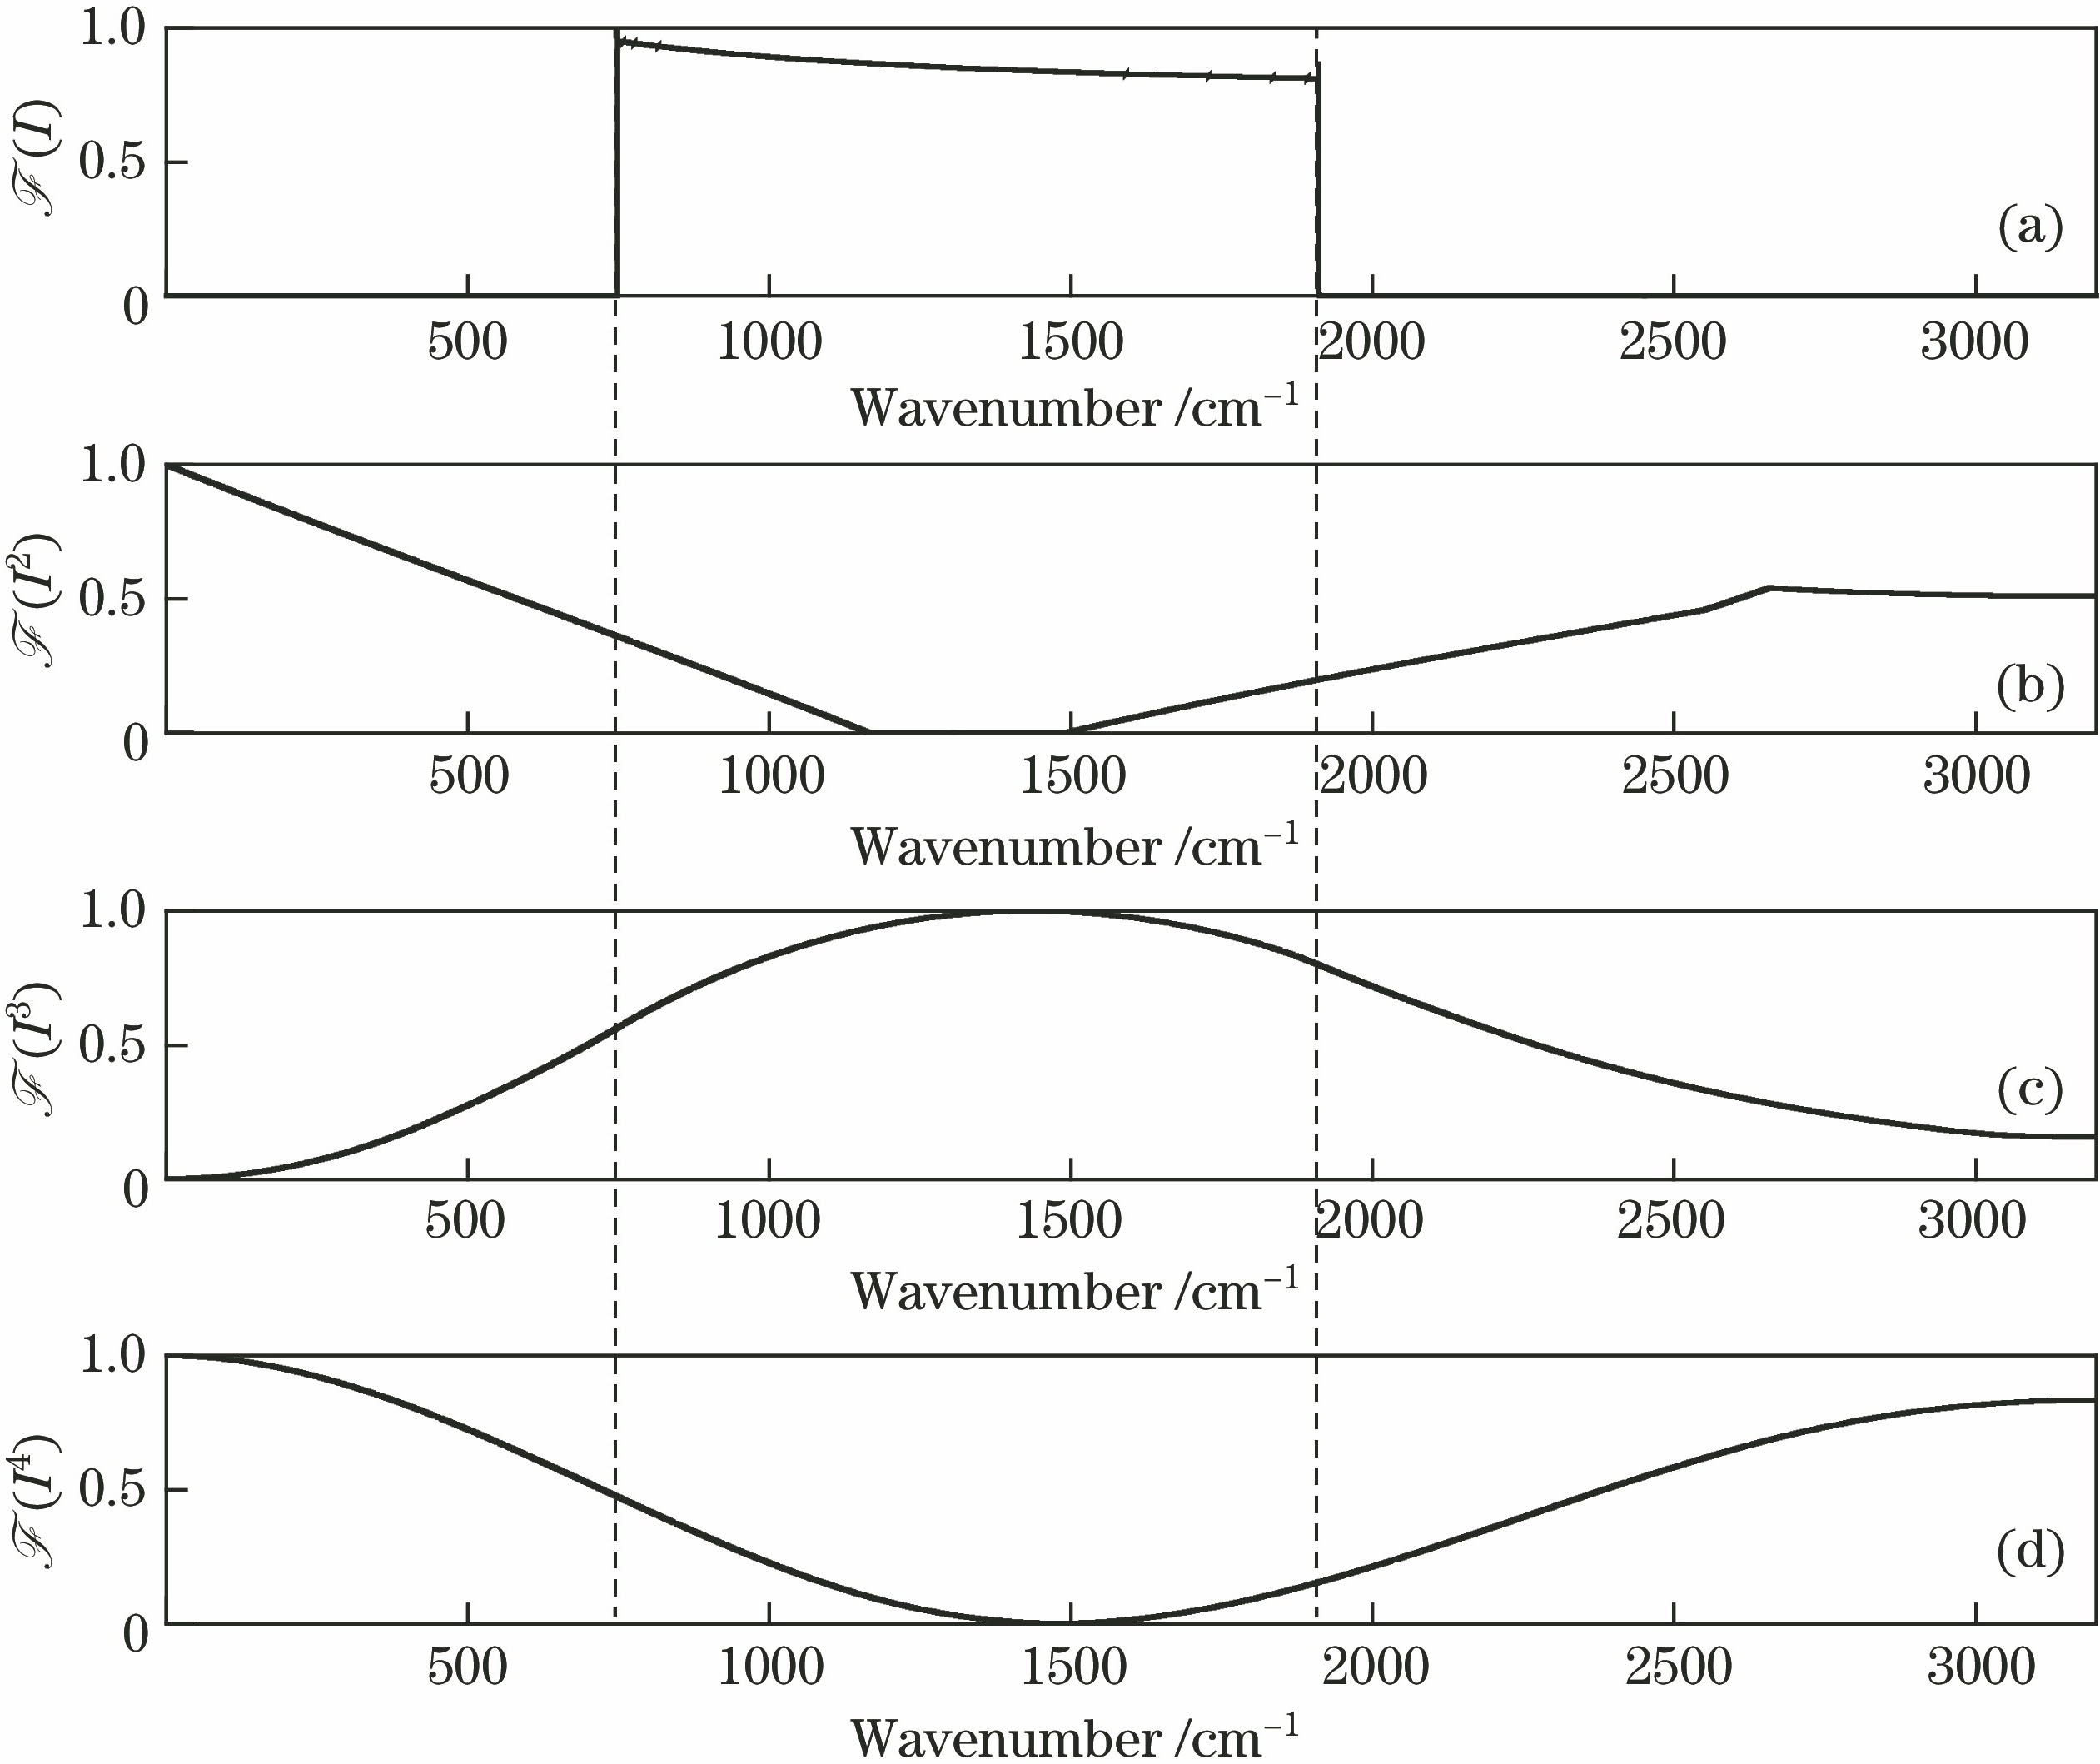
    Fig. 1. Spectra recovered from interferograms with different orders. (a) The first order response; (b) the second order response; (c) the third order response; (d) the fourth order response
    Spectra recovered from nonlinear interferogram with traditional method
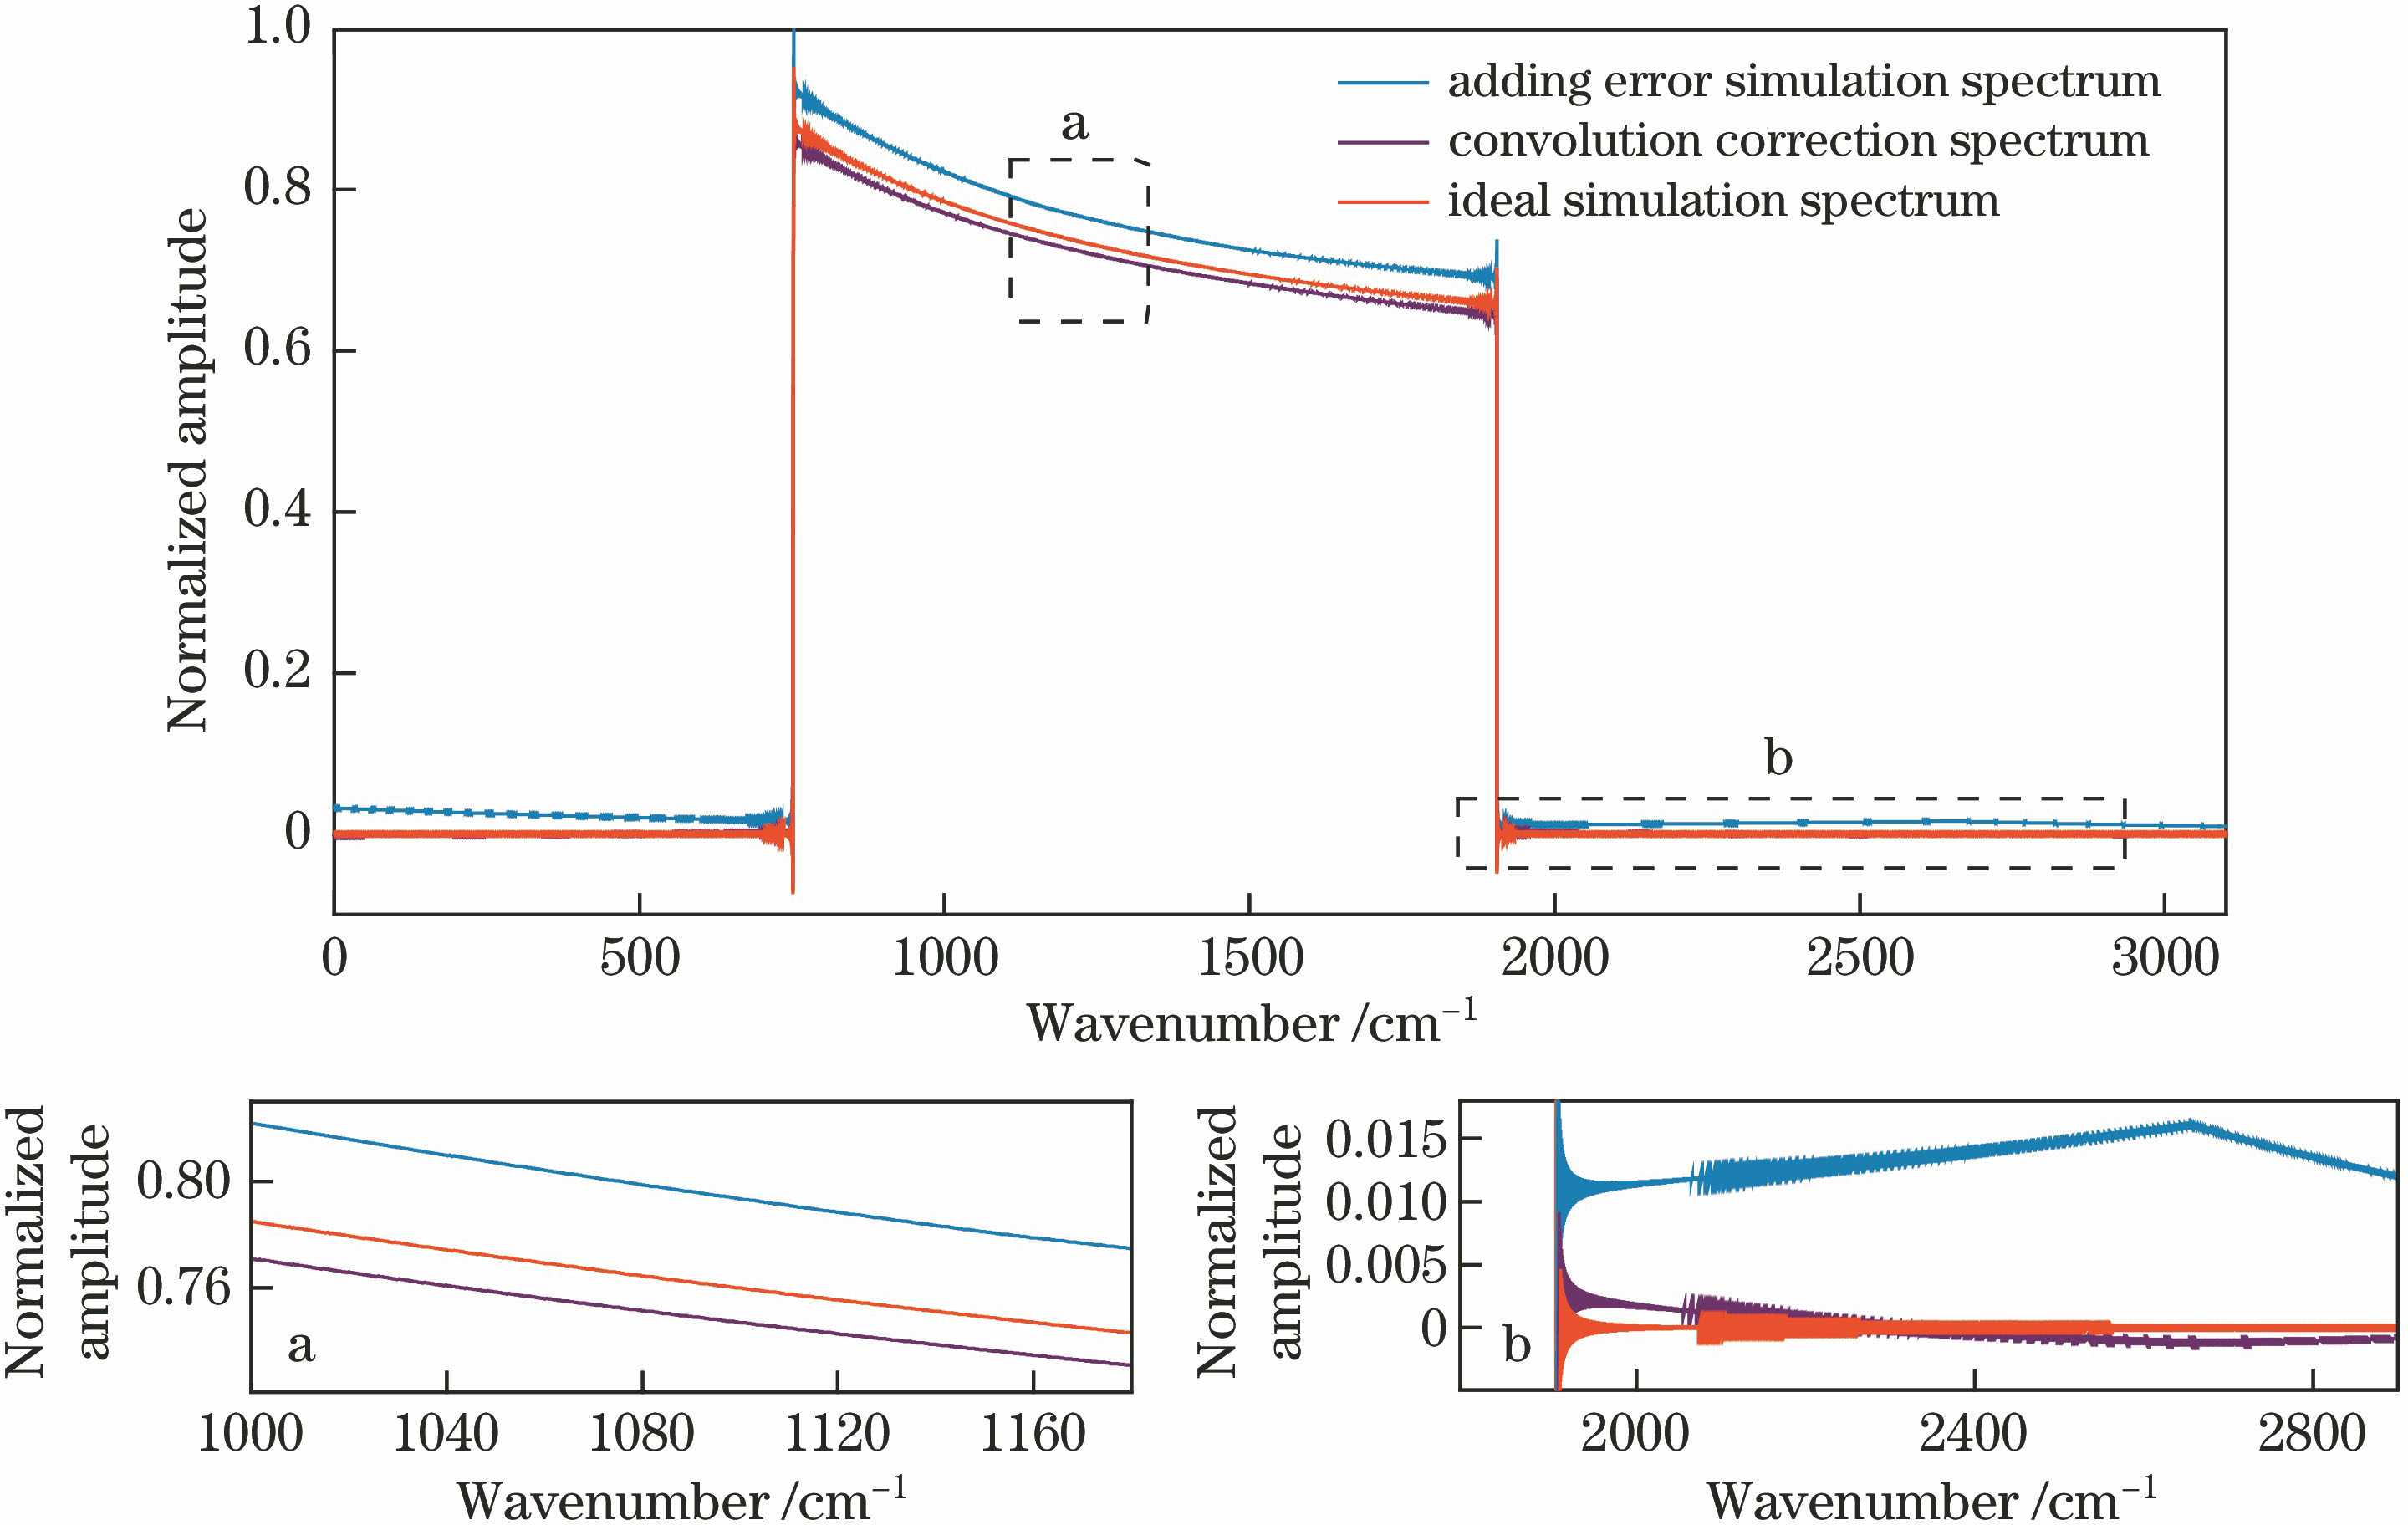
    Fig. 2. Spectra recovered from nonlinear interferogram with traditional method
    Spectra recovered from nonlinear interferogram corrected with cross-iteration method
    Fig. 3. Spectra recovered from nonlinear interferogram corrected with cross-iteration method
    Influence of direct current voltage deviation on correction accuracy
    Fig. 4. Influence of direct current voltage deviation on correction accuracy
    Schematic of detector nonlinear correction experiment
    Fig. 5. Schematic of detector nonlinear correction experiment
    Spectra recovered from blackbody at different temperatures observed by detector
    Fig. 6. Spectra recovered from blackbody at different temperatures observed by detector
    Radiation spectra of blackbody before and after correction at 2200 ℃. (a) Entire spectra; (b)-(d) partial enlarged details
    Fig. 7. Radiation spectra of blackbody before and after correction at 2200 ℃. (a) Entire spectra; (b)-(d) partial enlarged details
    Fitted curves at wavenumber of 1237.9 cm-1 before and after correction
    Fig. 8. Fitted curves at wavenumber of 1237.9 cm-1 before and after correction
    Wavenumber /cm-1R2
    Before correctionSecond-order correctionThird-order correction
    1237.90.99640.99910.9996
    1253.20.99650.99880.9994
    1266.10.99430.99890.9996
    1280.10.99630.99870.9994
    1293.10.99680.99890.9995
    Table 1. Corrected goodness R2 of undisturbed wavenumbers before and after correction
    Song Ye, Yongfeng Sun, Zhiwei Li, Hailiang Shi, Wei Xiong, Xinqiang Wang, Jiejun Wang, Wentao Zhang. [J]. Acta Optica Sinica, 2018, 38(6): 0612007
    Download Citation