The spectral domain interferometer (SDI) has been widely used in dimensional metrology. Depending on the nature of the SDI, both wider spectral bandwidth and narrower linewidth of the light source are paradoxically required to achieve better resolution and longer measurable distances. From this perspective, a broadband frequency comb with a repetition rate high enough to be spectrally resolved can be an ideal light source for SDIs. In this paper, we propose and implement a broadband electro-optic frequency comb to realize a comb-mode resolved SDI. The proposed electro-optic frequency comb was designed with an optically recirculating loop to provide a broadband spectrum, which has a repetition rate of 17.5 GHz and a spectral range of 35 nm. In a preliminary test, we demonstrated absolute distance measurements with sub-100 nm repeatability. Because of these advantages, we believe this electro-optic frequency comb can open up new possibilities for SDIs.
1. INTRODUCTION
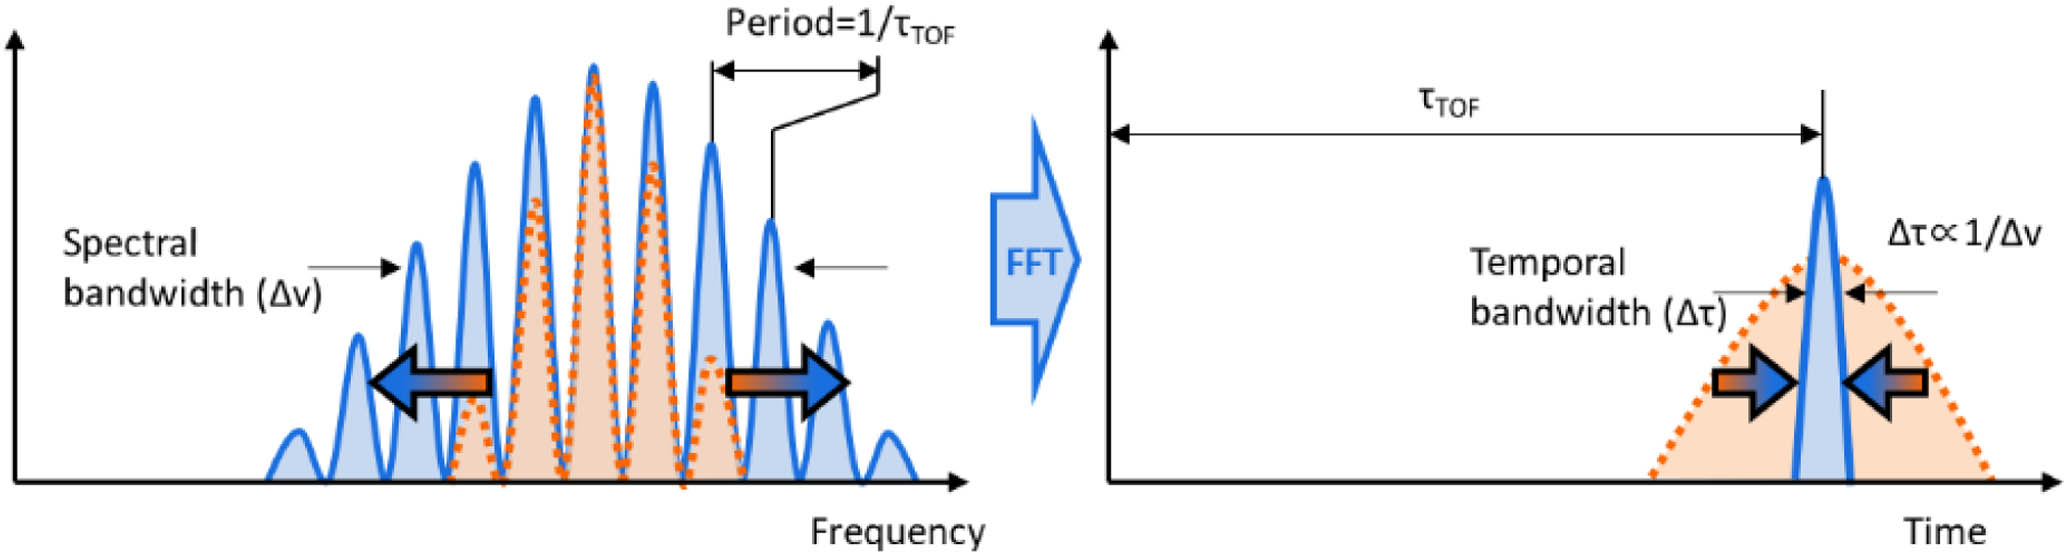
The spectral domain interferometer (SDI) has long been used in many applications for a wide range of purposes, which include high-precision optical metrology (specifically, absolute distance measurement) [1], bio-imaging (or, more generally, optical coherence tomography) [2], industrial instrumentation [3], and observation of ultrafast dynamics [4] due to the nature of real-time measurement with high precision. Regarding the basic principles of the SDI, as shown in Fig. 1, the time of flight () proportional to the distance is easily obtained from the period of the interference spectra in the spectral domain, with the resolution determined by the spectral bandwidth of the light source in use. Due to the inverse relationship between the spectral bandwidth of the light source and the resolution of the distance measurements [5], broadband light sources such as tungsten–halogen lamps, superluminescent laser diodes, and LEDs have been widely used to improve the measurement resolution of SDIs. On the other hand, the short coherence length caused by the wide spectral bandwidth unavoidably limits the measurement range by decreasing the visibility of the interference pattern. The measurable range also can be limited by the wavelength resolution of the spectrometer. For these reasons, SDIs have been mainly used in relatively short ranges [6,7].
Figure 1.Relationship between the spectral bandwidth and temporal bandwidth (or dimensional resolution) of the light source in spectral domain interferometry. Blue curves denote broadband light sources and orange dashed curves denote narrowband light sources. As the optical spectrum has larger spectral bandwidth, the converted time domain signal has narrower temporal bandwidth, resulting in high-resolution dimensional metrology. , spectral bandwidth; and , temporal bandwidth.
The advent of the frequency comb, which has the unique characteristics of an ultrashort pulse duration in the time domain and a broadband spectrum in the spectral domain but a narrow linewidth of individual comb modes, has brought a breakthrough in optical metrology over the last two decades [8]. Especially for dimensional metrology [9], the frequency comb enables and advances many absolute distance measurements, including amplitude modulation ranging [10–12], frequency modulation ranging [13,14], multiwavelength interferometry [15–17], dual-comb ranging [18–20], microcomb ranging [1,21], and spectral domain interferometry [22–25].
Focusing on the SDI for precise measurement of long distances [26], paradoxically, both the wide spectral bandwidth to improve the measurement resolution and a narrow linewidth to extend the measurement range are simultaneously required. In this respect, the frequency comb can be suitable and promising to meet these requirements. However, considering the wavelength resolution of conventional spectrometers and a typical frequency comb with a sub-GHz repetition rate, it is impossible to spectrally resolve each frequency mode of the frequency comb with conventional spectrometers. Hence, the SDI using a typical frequency comb can only measure distances where the interference spectra are properly sampled within the coherence length, which is only a few centimeters [27–29].
Sign up for Photonics Research TOC. Get the latest issue of Photonics Research delivered right to you!Sign up now
To solve this problem, the SDI with a sub-GHz repetition rate frequency comb has been demonstrated using a Fabry–Perot etalon-based repetition rate multiplication of the frequency comb [23] or a high-resolution spectrometer based on a virtually imaged phase array and a grating [24,26]. However, the repetition rate multiplication method makes it nearly impossible to maintain a traceability chain from the frequency comb without an extremely high level of length control of the Fabry–Perot etalon. In addition, when using the high-resolution spectrometer based on the virtually imaged phase array and a grating, it is not easy to be widely exploited due to the complex system configuration. As another approach, a chip-scale microcomb has begun to be used in SDIs with a high repetition rate exceeding 10 GHz, which allows the frequency modes to be resolved with commercially available spectrometers [1,22]. However, the microcomb falls well short of use in real-world applications due to practical issues related to its complex startup and operation protocol for stable and single soliton generation. Moreover, the repetition rate of the microcomb is practically difficult to control so as to be locked to traceable references.
For real-world applications, an electro-optic frequency comb (EO comb) can efficiently resolve the practical issues in previous works on SDIs. The EO comb is well established for easy and stable operation and is being used in various applications [30], such as high-precision spectroscopy [31], communications [32], microwave photonics [33], ultrastable optical frequency generation [34], and distance measurements [35,36]. However, one critical drawback related to an SDI with an EO comb is that the spectral bandwidth is limited to a few nanometers, which is not sufficiently broad to achieve high-precision dimensional metrology [5,37]. To overcome this drawback, various methods, including an optically recirculating loop [38,39], nonlinear optical loop mirror (NOLM) [40], and nonlinear amplified loop mirror (NALM) [41] have been studied to broaden the spectral bandwidth with low power amplification of only a few hundreds of mW. Conventional methods, on the other hand, that use highly nonlinear fiber (HNLF) typically require power amplification of a few watts [42,43].
In this work, a comb-mode resolved SDI is proposed and realized by developing a high-repetition-rate EO comb with a wide and smooth spectral bandwidth of more than 30 nm. An optically recirculating loop with the HNLF was used to extend the spectral bandwidth and generate a smooth and stable spectral shape to improve the SDI’s precision and accuracy. The developed EO comb has a repetition rate of 17.5 GHz, which allows each comb mode to be easily resolved and detected with conventional spectrometers. It theoretically enables a user to extend the measurement range beyond the spectrometer limited range up to the coherence length of the light source. In addition, the optically recirculating loop enables the generation of ultrashort soliton pulses with a pulse duration of 522 fs and a wide spectral range of 35 nm at a center wavelength of 1560 nm, which is wide enough to achieve nanometric resolutions. The repetition rate of the proposed EO comb was well stabilized to the microwave frequency standard with stability at an averaging time of 10 s with traceability to the length standard. To verify its practical use for rapid, high-precision distance measurements, a fixed target at 100 mm was measured by the proposed EO-comb-based SDI with a sampling rate of 3 kHz. At arbitrary distances, the measurement repeatability and linearity were also investigated. Therefore, the proposed EO comb can be a key component to realize an ideal SDI with a remarkably long measurement range and traceability to well-known length standards. Especially operating at long distances, it is expected that the comb-mode resolved interferometer will be promising as another alternative to laser interferometers in various precision engineering fields.
2. METHODS AND RESULTS
A. Broadband EO Comb Generation with an Optically Recirculating Loop
Figure 2 shows the proposed EO comb generation with an optically recirculating loop compared to that of a typical EO comb generation. In Fig. 2(a), the typical EO comb is generated with a CW laser as a seed laser, an intensity modulator [IM in Fig. 2(c)], and multiple phase modulators (PM1, PM2, and PM3) arranged in series. There are typically two or three phase modulators. All modulators are driven by the same RF synthesizer. The RF synthesizer was referenced to GPS time and a frequency system (FS740, Stanford Research Systems), providing a 10 MHz reference signal with a long-term absolute stability of . The relative phases of the driving signal for the phase modulator must be aligned using electrical RF phase shifters [PS1, PS2, and PS3 in Fig. 2(a)]. In this study, the seed laser (FRL15DCWB-A81-19200-A, OFS Fitel) with a spectral linewidth of 2 MHz, corresponding to a coherence length of 150 m, has a central wavelength of 1561.42 nm (C20 in ITU grid) with an output power of 20 mW. Note that the carrier-envelope offset frequency, which was governed by the frequency variation of the seed laser, was not stabilized. However, it does not affect the measurement precision considering a typical variation of a few tens of MHz. Further details can be found in Appendix A. The repetition rate is precisely determined by the driving frequency of the modulators to create equally spaced modes on the EO comb. The intensity modulator (MXER-LN-20, iXblue) was driven at an RF signal of 17.5 GHz with its DC bias adjusted to the applicable quadrature point. The phase modulators (PM-5S5-20, EOSPACE) with low of 3 V at 1 GHz were driven by a 3 W RF amplifier (ZVE-3W-183+, Mini-Circuits).
Figure 2.Broadband EO comb generation. (a) Typical EO comb generation scheme. (b) Generated EO comb from the scheme shown in (a). Inset shows a zoomed-in view. (c) Proposed method of EO comb generation with the optically recirculating loop. (d) Generated EO comb from the scheme in (c). Inset shows a zoomed-in view on a scale identical to that in the inset of (b).
Figure 2(b) shows a typical optical spectrum of the EO comb from the typical configuration described in Fig. 2(a). When the relative phases of the driving signal for the phase modulator are well aligned, the optical spectrum shows flat-top shape with “rabbit ears” at the outer part [37]. The spectral bandwidth was typically 4.5 nm centered at a wavelength of 1562 nm.
Figure 2(c) presents the optical configuration of the proposed EO comb with the optically recirculating loop, which is a quasi-oscillator, for an effective broadband spectrum. The key component to realize the optically recirculating loop was a fiber Bragg grating (FBG) filter that efficiently combines the CW laser and the EO comb, as shown in the inset of Fig. 2(c). An erbium-doped fiber amplifier [EDFA1 in Fig. 2(c)] with a 50 mW amplification was also used to compensate for the internal loss of the intensity modulator and cascaded phase modulators. After the cascaded phase modulators, another EDFA [EDFA2 in Fig. 2(c)] enhanced the optical power of the EO comb from 180 to 450 mW. The amplified EO comb was incident to an HNLF of 100 m for spectral broadening. Then, half of the EO comb was sent to the output port and the other half was delivered to the FBG filter for the optically recirculating loop. This optically recirculating loop effectively enabled spectral broadening with relatively low power amplification of 180 mW, while a typical EO comb requires an output power on the level of a few watts for spectral broadening with an HNLF. This makes the proposed EO comb simple and competitive for practical applications. The typical optical spectrum is shown in Fig. 2(d).
Figure 3 shows the details of the optical characteristics of the proposed EO comb generation. In Fig. 3(a), the spectral evolution of the proposed EO comb generation is depicted as a sequence. The optical spectrum was measured at the output port in Fig. 2(c). A CW laser as a seed laser was injected at a center wavelength of 1562 nm. Without the optically recirculating loop of the EO comb, denoted as the “single pass” type, as mentioned earlier, the generated EO comb had a spectral bandwidth of only 4.5 nm and a flat-top spectrum, as plotted by the yellow line in the inset of Fig. 3(a). On the other hand, by using the optically recirculating loop of the EO comb, the optical spectrum of the proposed EO comb was remarkably broadened. With more power amplification from 180 to 450 mW, the optical spectrum gradually became broader while retaining its spectrum shape. The 10 dB spectral bandwidth was estimated to be 10.5 nm at a power amplification of only 450 mW, and the comb lines clearly appeared from 1545 to 1580 nm. Figure 3(b) shows the long-term stability of the optical spectrum over 100 s. During the measurements, the optical spectrum was well maintained without a notable drift or fluctuation, and it was sufficient to measure distances by the SDI. The upper section of Fig. 3(b) shows an enlarged wavelength range from 1560 to 1565 nm to monitor individual comb modes.
Figure 3.Optical characterization of the EO comb. (a) Spectral evolution of the EO comb. (b) Long-term stability of the optical spectrum with power amplification of 450 mW. The upper section shows a zoomed-in view of 1560–1565 nm. The red line on the mid-section is the curve fitting line (see Fig. 8 for an extended view). (c) Pulse duration measurement by the interferometric autocorrelator for power amplification of 450 mW. The filtered autocorrelation signal was fitted to a curve. (d) Intensity autocorrelation signal for power amplification of 180 mW and 450 mW. The yellow line shows the intensity autocorrelation signal for the single-path EO comb.
The pulse duration was measured by an interferometric autocorrelator [pulseCheck, Angewandte Physik & Elektronik (APE)], as shown in Figs. 3(c) and 3(d). With a power amplification of 450 mW, the temporal width of the interferometric autocorrelation signal was 807 fs, corresponding to a pulse duration of 522 fs assuming -shaped pulses. As shown in the inset of Fig. 3(c), the filtered autocorrelation signal (red color) was well fitted to a shape without notable differences. Similarly, in Fig. 3(d), the pulse duration for a power amplification of 180 mW was 622 fs, assuming -shaped pulses. However, the pulse duration for a single path was 9.77 ps, which is much longer than the dispersion-compensated pulse duration of 1.1 ps with 300 m of single-mode fiber (see Appendix B). Hence, as shown in Fig. 3(d), the proposed EO comb forms solitary wave pulses well, while the pulses generated by the single path contain a large chirp that must be compensated for with a long optical fiber [41,43]. The fundamental physics behind this interesting phenomenon will be investigated in a future study.
To investigate the RF characteristics of the proposed EO comb, the RF spectra and time-dependent frequency variations for both the RF synthesizer and the proposed EO comb were measured. Figure 4(a) shows the power spectral densities of the RF synthesizer (red color) and the proposed EO comb (blue color) with a resolution bandwidth and a video bandwidth of 30 kHz, with both signals having an SNR exceeding 50 dB. Also, in Fig. 4(b), the time-dependent frequency deviation outcomes of both signals at 17.5 GHz were measured by an RF frequency counter (53220A, Agilent) with a gate time of 0.1 s and then down-converted to 80 kHz using an RF mixer and an RF local oscillator. According to the measurement results, the proposed EO comb had slightly larger time-dependent fluctuation than the RF synthesizer, but the difference was not much significant. The fluctuations of both signals were random within a few tens of mHz. In addition, with the frequency reference of a GPS-driven atomic clock, the Allan deviations of the RF synthesizer and the proposed EO comb were estimated to be and at an averaging time of 1 s, respectively, which are outcomes that showed a difference of less than one order of magnitude. Therefore, because both the RF synthesizer and the EO comb are traceable to the frequency reference, it is expected that the frequency stability of the proposed EO comb can be well maintained or not be significantly degraded.
Figure 4.RF characteristics of the EO comb. (a) RF spectrum near the repetition rate with a resolution bandwidth (RBW) and video bandwidth (VBW) of 30 kHz. (b) Repetition rate fluctuation over 10 min. (c) Frequency stability of the repetition rate in terms of the Allan deviation.
B. High-Precision Distance Measurement by the EO Frequency Comb-Based SDI
A static target was measured at approximately 100 mm to demonstrate the feasibility of high-precision distance measurements using the proposed EO comb. The optical layout is shown in Fig. 5(a). In this case, 4% of Fresnel light reflected from the end face of an FC/PC fiber ferrule connected to a collimating lens (CL) was used as a reference beam. The transmitted beam was reflected from the target mirror () and recombined with the reference beam through a circulator. The combined beam was sent to the spectrometer (I-MON 512 HS, Ibsen Photonics) to obtain the interference spectrum, as shown in Fig. 5(b). Note that the repetition rate of 17.5 GHz was chosen to match each comb mode to a single pixel of a spectrometer. According to the basic principle of the SDI, as outlined in Fig. 1 [1,3,5,6,25,44,45], the target distance can easily be determined from the Fourier transform of the interference spectrum. Figure 5(c) shows the time-dependent target distance variations measured with a sampling rate of 3 kHz for 10 s in the time domain. The mean value of the measured distance values was 104,437.96 μm with a standard deviation () of 522 nm. During the measurement, a notable drift did not appear, and a histogram of the measured distances was well fitted to a normal distribution, as shown in the section on the right in Fig. 5(c). Note that the refractive index induced measurement drift can be ignored for short time scale of 10 s [48]. To evaluate the measurement repeatability, the Allan deviation was calculated from the measured distance values shown in Fig. 5(c), as presented in Fig. 5(e). The Allan deviation was 502 nm at an average time of 333 μs (without averaging) and gradually decreased to 50 nm at an averaging time of 67 ms with a white-noise-limited precision of , where is the averaging time. Hence, the standard uncertainty [] can be expressed as , where is the standard deviation of the measured distance and is the number of the data instances. On a short-term time scale, the measurement repeatability is generally white-noise limited by intensity fluctuations in the measured interference spectra [1]. The measured repeatability was in good agreement with that obtained from the numerical simulations, which accounted for our typical value of 1%–1.5% variation in the intensity. This is usually limited by the spectrometer, not the light source itself (see Appendix C). At a longer average time of 67 ms, random walk and flicker noise sources gradually dominated due to environmental drift. Although our task was performed to check the applicability of the proposed device as a preliminary test, the measurement repeatability in terms of the Allan deviation was comparable to state-of-the-art outcomes of high-repetition-rate (over 15 GHz) light-source-based absolute distance measurements such as those by microcomb-based spectral interferometry [green curve in Fig. 5(e)] [1], microcomb-based dual-comb ranging [pink curve in Fig. 5(e)] [21], and AMCW ranging [orange curve in Fig. 5(e)] [46,47]. In the frequency domain analysis conducted here, the power spectral densities from 100 mHz to 1.5 kHz were calculated from the time domain measurement results in Fig. 5(d). As shown in Fig. 5(d), the power spectral densities from 100 mHz to 10 Hz were dominated by random walk noise, which typically appeared as noise. In the higher frequency range exceeding 10 Hz, the power spectral density was dominated by white noise (or random noise) at , well matched to the conversion from the power spectral density to the Allan deviation.
Figure 5.EO-comb-based high-precision distance measurement. (a) Experimental setup of the EO-comb-based spectral interferometer. CL, collimating lens; and M, mirror. (b) Typical spectral interference pattern measured by the spectrometer. (c) Time-dependent variation of the measured distance over 10 s and corresponding histogram. The yellow line in the section on the left shows the 100-point moving-average line. The red line in the section on the right shows the line fitted to a normal distribution. (d) Power spectral density of the measured distance from 0.1 Hz to 1.5 kHz. (e) Measurement repeatability in terms of the Allan deviation. The gray dashed line denotes the white-noise-limit fitted line. The green dashed line and yellow dashed line are the numerical simulation results for the intensity-fluctuation-induced measurement repeatability. (f) Measurement linearity test results with the laser displacement interferometer over 1.6 mm in 0.2 mm steps.
To evaluate the measurement linearity of the comb-mode resolved SDI operating with the EO comb, a commercial homodyne laser displacement interferometer with less than 10 nm linearity error was adopted as a reference. The target mirror was translated with a constant step of 0.2 mm at 7.6 mm, which is large enough to evaluate a periodic error when compared to a nonambiguity range of 4.283 mm. The distances measured over the nonambiguity range were wrapped, as shown in lower section of Fig. 5(f) due to phase ambiguity. As a result of the measurements in upper section of Fig. 5(f), the difference between the SDI and the reference was less than μ () without notable periodic error components, except for a specific point near the nonambiguity range where time-domain signals were partially overlapped. Importantly, the measurement linearity was nearly equivalent to the measurement repeatability without averaging.
3. SUMMARY
A comb-mode resolved SDI was proposed and realized by developing a high-repetition-rate EO comb with an optically recirculating loop. The proposed EO comb has a repetition rate of 17.5 GHz, a pulse duration of 522 fs, and a spectral range of 35 nm at a center wavelength of 1560 nm, making it an ideal light source for the practical implementation of comb-mode resolved SDIs. Because the repetition rate was well stabilized to a microwave frequency reference with stability without stability degradation from the microwave synthesizer to the EO comb, measured distances are directly traceable to the length standard according to the definition of the meter, which, with symbol m, is the SI unit of length. To verify the effectiveness of using the EO comb as a light source for the comb-mode resolved SDI, the distances of both a static target and a moving target were measured as a preliminary test. As a result of the measurements, it was found that the repeatability and accuracy were below 100 nm and μ, respectively. Even with the simple method, the outcomes were comparable to those of state-of-the-art absolute-distance measurement approaches. Figure 6 shows a comparison of the measurement capabilities here and state-of-the-art techniques in terms of the measurement precision and speed. (See Appendix D.) Therefore, with the proposed EO comb, we believe the comb-mode resolved SDI can be one of the new options to realize length standard with sub-100 nm repeatability and high measurement speed.
Figure 6.Comparison of the measurement capabilities with state-of-the-art absolute distance measurement methods. The horizontal axis shows the update rate of the measurement and the vertical axis shows the repeatability without averaging. The yellow diagonal dashed line shows the white-noise-limited precision at an averaging time of 1 s. (See Appendix D.)
APPENDIX A: INFLUENCE OF THE FREQUENCY VARIATION OF THE SEED LASER
An influence of the frequency variation of the seed laser was numerically analyzed. Assuming that the repetition rate was constant in this analysis, the frequency variation of the seed laser gives a frequency offset to all the comb structures. First, the influence on the FFT algorithm based peak detection from 1 Hz to 10 GHz was numerically simulated. As shown in Fig. 7(a), the frequency offset induced distance errors for 1 mm, 100 mm, and 10 m were found to be less than 10 nm, while the typical FFT peak detection errors was about 2.9 nm and the measurement repeatability was about 50 nm at averaging time of 0.03 s. Considering that the typical frequency offset or variation is a few tens of MHz even for a long-term time scale, the frequency variation induced measurement error can be ignored. Second, the frequency variation induced change of the refractive index of air was also investigated using the Ciddor equation [48,49]. A 100 GHz (or 1 nm) variation of the seed laser induces a level variation of the refractive index of air. It can be concluded that the carrier-envelope offset frequency of the EO comb is optional, but mode-spacing should be equally spaced by the stabilization of the repetition rate.
Figure 7.Frequency variation of the seed laser induced measurement error. (a) Frequency variation of the seed laser induced measurement error for 1 mm, 100 mm, and 10 m, typical FFT peak detection error and measurement repeatability. (b) Refractive index change induced measurement error for 1 mm, 100 mm, and 10 m.
APPENDIX B: ADDITIONAL MEASUREMENT OF OPTICAL SPECTRUM AND PULSE DURATION
Figures 8 and 9 show additional measurements of the optical spectrum and pulse duration of the proposed EO comb.
Figure 8.Extended view of Fig. 3(b) for the optical spectrum fitted to a curve. Curve fitting results of the measured spectrum on (a) a log scale and (b) a linear scale.
Figure 9.Pulse compression for a single path. The pulse durations were measured and found to be 9.5 ps, 1.1 ps, and 2.4 ps for no pulse compression, SMF 300 m, and SMF 500 m, respectively.
APPENDIX C: CHARACTERIZATION OF INTENSITY FLUCTUATIONS OF THE SPECTRAL INTERFEROMETER
On a short time scale (generally ), the measurement repeatability is generally bounded to a white noise limit. The white noise limit is known to be induced by intensity fluctuations of the measured spectrum during a measurement. To investigate this effect on the method proposed here, we compared the Allan deviation outcomes from the experiments and numerical simulation results, as shown in Fig. 10. For the numerical simulation, the intensity fluctuation of the measured spectrum was simulated by adding Gaussian-shaped noise to the measured spectrum. The intensity fluctuation level was defined as the standard deviation of the Gaussian-shaped noise. For the experimental results, high-noise states were artificially created to generate the measured spectra with a low SNR. The high-noise states were generated with 4% and 6% of intensity fluctuation, while the intensity fluctuation is typically 1%–2%. Note that the intensity fluctuations for the experimental results are standard deviation values. The experimental results for 4% and 6% of intensity fluctuations are well matched with the numerical simulation for 3% and 5% of intensity fluctuations, respectively. The experimental results for the general case described in the main text were taken between numerical simulations with 1% and 1.5% of intensity fluctuation. Note that such intensity fluctuations are typically limited by the spectrometer, not by the light source. However, if the target distance is quite long or measured under a harsh environment, the intensity fluctuation may exceed the limit of the spectrometer, which can worsen the measurement repeatability.
Figure 10.Comparison of numerical simulation and experimental results for measurement repeatability. Thin lines denote the numerical simulation results and thick lines denote the experimental results.
APPENDIX D: SUMMARY COMPARISON BETWEEN THE STATE-OF-THE-ART ABSOLUTE DISTANCE MEASUREMENT METHOD AND THE PROPOSED DISTANCE METROLOGY APPROACH
Table 1 shows a summary comparison between the state-of-the-art absolute distance measurement method and the proposed distance metrology approach in terms of the nonambiguity range, measurement repeatability, linearity, and sampling rate.
Summary Comparison between State-of-the-Art Absolute Distance Measurement Method and the Proposed Distance Metrology Approach
Reference
Metrology Approach
Repetition Rate (MHz)
Non-ambiguity Range
Linearity Error ()
White-Noise Limited Precision ()
Repeatability ()
Sampling Rate
[1]
Chip-scale soliton microcomb based SDI
88,500
1.7 mm
12 nm
1 Hz
[13]
Frequency comb assisted frequency modulated continuous wave
1,000,000
N/A
6 nm
1 kHz
[16,17]
Frequency comb referenced multi-wavelength interferometry