• Chinese Optics Letters
  • Vol. 19, Issue 11, 114001 (2021)
Zhaojing Hu, Yunxiang Zhang, Shuping Lin, Shiqing Cheng, Zhichao He, Chaojie Wang, Zhiqiang Zhou, Fangfang Liu, Yun Sun, and Wei Liu*
Author Affiliations
  • Institute of Photoelectronic Thin Film Devices and Technology of Nankai University, Key Laboratory of Photoelectronic Thin Film Devices and Technology of Tianjin, Engineering Research Center of Thin Film Photoelectronic Technology, Ministry of Education, Tianjin 300350, China
  • show less
    DOI: 10.3788/COL202119.114001 Cite this Article Set citation alerts
    Zhaojing Hu, Yunxiang Zhang, Shuping Lin, Shiqing Cheng, Zhichao He, Chaojie Wang, Zhiqiang Zhou, Fangfang Liu, Yun Sun, Wei Liu. Incorporation of Ag into Cu(In,Ga)Se2 films in low-temperature process[J]. Chinese Optics Letters, 2021, 19(11): 114001 Copy Citation Text show less
    Sketch diagram of the absorber layer deposition process. The PRE-Ag process is referring to the Ag–Se precursor deposition process, which was prepared before the CIGS deposition process. In addition, the Ag surface treatment process carried out on the surface of CIGS films is denoted as the PDT-Ag process.
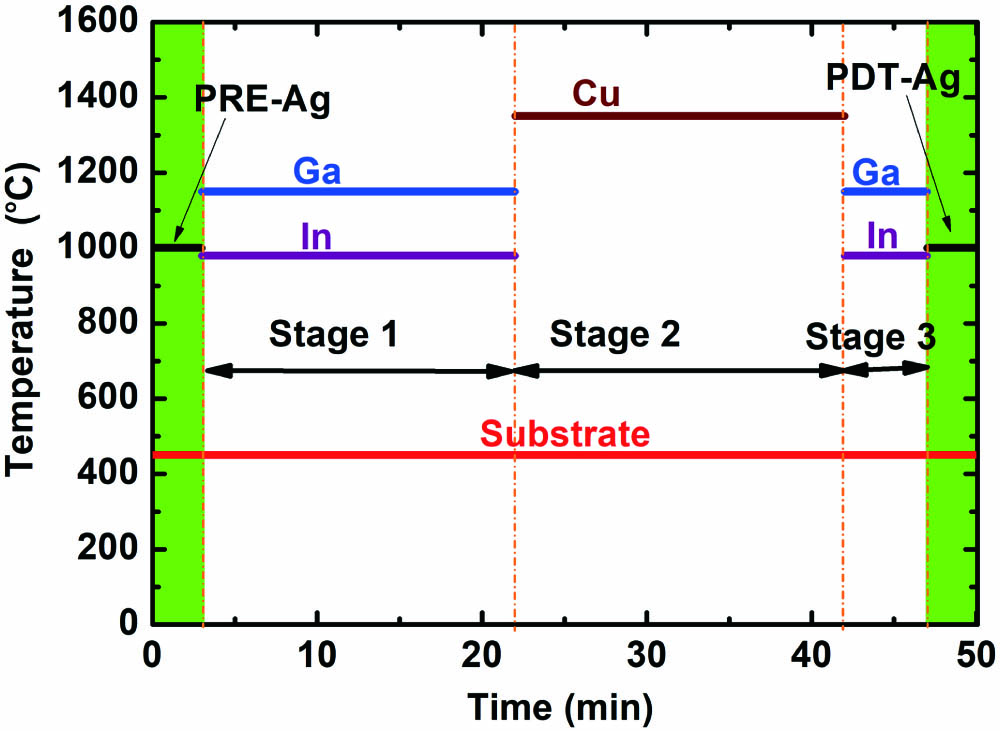
    Fig. 1. Sketch diagram of the absorber layer deposition process. The PRE-Ag process is referring to the Ag–Se precursor deposition process, which was prepared before the CIGS deposition process. In addition, the Ag surface treatment process carried out on the surface of CIGS films is denoted as the PDT-Ag process.
    (a) XRD patterns of the CIGS films with Ag. (b) The corresponding grazing incident X-ray diffraction (GIXRD) patterns of absorber layers.
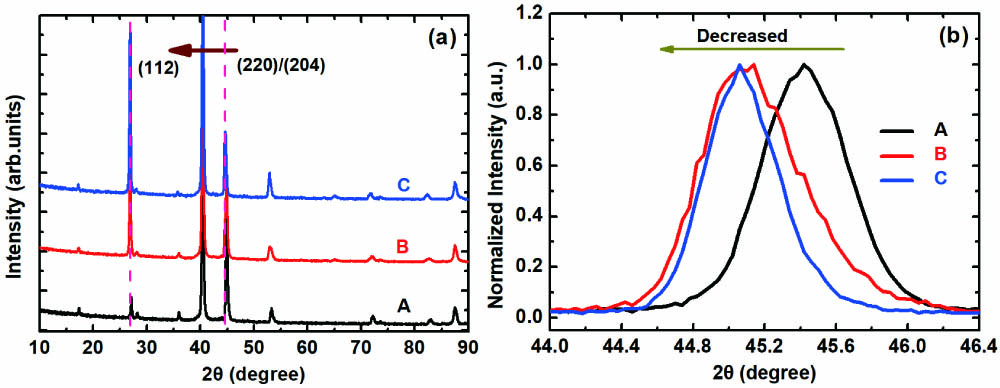
    Fig. 2. (a) XRD patterns of the CIGS films with Ag. (b) The corresponding grazing incident X-ray diffraction (GIXRD) patterns of absorber layers.
    Cross-sectional SEM images of CIGS films of (a) A, (b) B, and (c) C.
    Fig. 3. Cross-sectional SEM images of CIGS films of (a) A, (b) B, and (c) C.
    (a) J-V curves of the best CIGS solar cells fabricated from the different absorber samples. Statistic boxes for the (b) VOC, (c) JSC, and (d) FF and each box contains over 10 solar cells.
    Fig. 4. (a) J-V curves of the best CIGS solar cells fabricated from the different absorber samples. Statistic boxes for the (b) VOC, (c) JSC, and (d) FF and each box contains over 10 solar cells.
    (a) External quantum efficiency (EQE) spectrum. (b) The band gap value obtained by EQE fitting curve. (c) Doping concentration (Na) of different samples. (d) ln(EQE) as a function of photon energy to determine the Urbach energy (EU) values.
    Fig. 5. (a) External quantum efficiency (EQE) spectrum. (b) The band gap value obtained by EQE fitting curve. (c) Doping concentration (Na) of different samples. (d) ln(EQE) as a function of photon energy to determine the Urbach energy (EU) values.
    Charge barrier height Φb of different samples.
    Fig. 6. Charge barrier height Φb of different samples.
    SamplePRE-Ag (50 nm)PDT-Ag (50 nm)
    ANoNo
    BYesNo
    CNoYes
    Table 1. Deposition Conditions of Different Samples with Aga
    Ag-Treated SampleΔEU (meV)ΔVOC (mV)
    B13.512
    C14.712
    Table 2. Statistics of Different CIGS Samples in the ΔEU and ΔVOCa
    Zhaojing Hu, Yunxiang Zhang, Shuping Lin, Shiqing Cheng, Zhichao He, Chaojie Wang, Zhiqiang Zhou, Fangfang Liu, Yun Sun, Wei Liu. Incorporation of Ag into Cu(In,Ga)Se2 films in low-temperature process[J]. Chinese Optics Letters, 2021, 19(11): 114001
    Download Citation