
Shuailong Zhang, Mohamed Elsayed, Ran Peng, Yujie Chen, Yanfeng Zhang, Steven L. Neale, Aaron R. Wheeler, "Influence of light pattern thickness on the manipulation of dielectric microparticles by optoelectronic tweezers," Photonics Res. 10, 550 (2022)
- Photonics Research
- Vol. 10, Issue 2, 550 (2022)
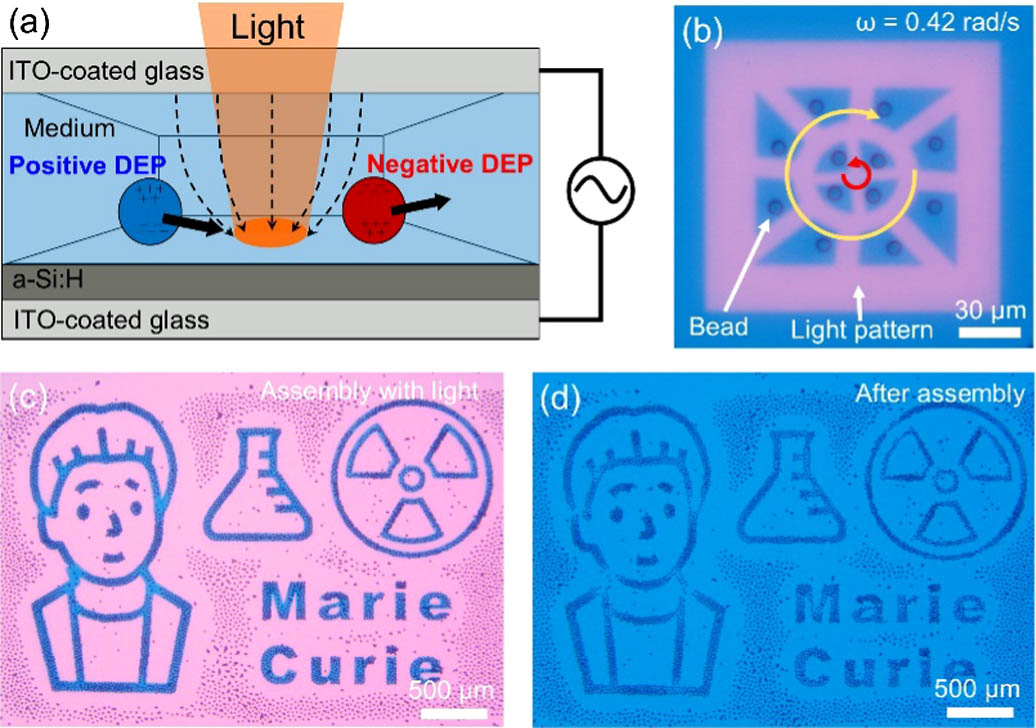
Fig. 1. (a) Schematic of an OET device, in which microparticles are manipulated via positive or negative DEP forces. (b) Video frame showing the use of dynamic light patterns to move/rotate multiple 10 μm polystyrene microbeads at an angular velocity of 0.42 rad/s. Red and yellow arrows represent the counterclockwise and clockwise rotational directions of the microbeads in the central and surrounding regions, respectively. Regions with red color represent the illuminated region, and regions with blue color represent the dark region. See Visualization 1 (clip 1) for more details. (c) Microscope image showing the illumination of the 10-μm-diameter microbead suspension with a light pattern depicting a stylized caricature of Marie Curie with symbols of an Erlenmeyer flask and radiation. Regions with red color represent the illuminated region, and regions with blue color represent the dark region. (d) Microscope image of the OET-assembled micropattern. See Visualization 1 (clip 2) for more details.
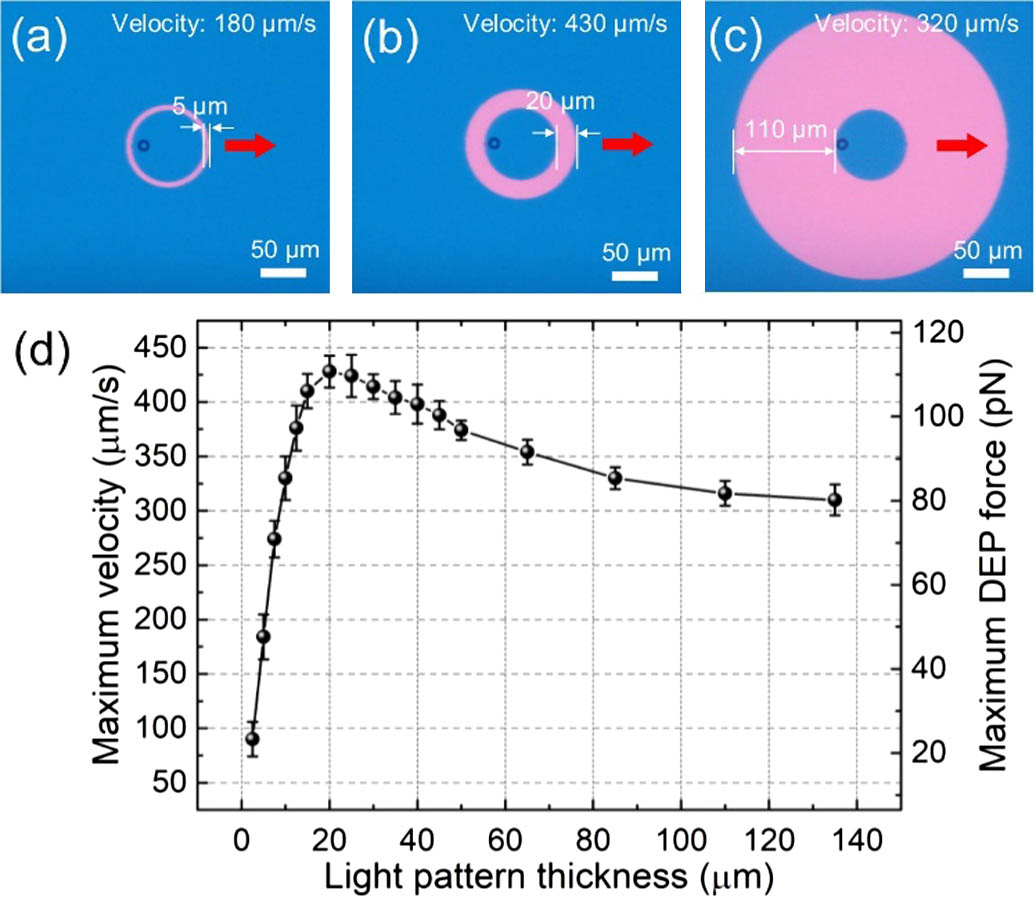
Fig. 2. (a)–(c) Microscope images of a 10 μm polystyrene microbead trapped by doughnut-shaped light patterns with the same inner diameter but different ring thicknesses (i.e., 5 μm, 20 μm, and 110 μm), and moving at 180 μm/s, 430 μm/s, and 320 μm/s, respectively. See Visualization 2 (clips 1–3) for more details. The red arrow represents the moving direction. (d) Maximum velocity (left axis) and maximum DEP force (right axis) versus light pattern’s ring thickness. The velocity refers to the velocity of microbeads in the horizontal direction. Error bars represent the standard deviation for five replicates.
Fig. 3. Plots of (a) simulated electric potential, and (b) simulated electric field for an OET trap formed by illuminating a doughnut-shaped light pattern on the photoconductive layer of an OET device. The simulated electric potential and electric field are plotted in heat maps (blue, low; red, high). The inset in (b) is a magnified view of the main-panel data in the dashed square. Simulated gradients of electric field square (c) along x y
Fig. 4. (a)–(c) Microscope images of a 10 μm polystyrene microbead moved by rectangular-shaped light patterns with the same length but different thicknesses (i.e., 5 μm, 25 μm, and 110 μm), and moving at 35 μm/s, 125 μm/s, and 90 μm/s, respectively. The red arrow represents the moving direction. See Visualization 3 for more details. (d) Maximum velocity (left axis) and maximum DEP force (right axis) versus light pattern’s thickness, in which error bars represent the standard deviation for five replicates. The velocity refers to the velocity of microbeads in the horizontal direction.
Fig. 5. (a) SEM image of a micro-gear. (b)–(d) Microscope images of a micro-gear trapped by doughnut-shaped light patterns with the same inner diameter but different ring thicknesses (i.e., 10 μm, 40 μm, and 110 μm), and moving at 300 μm/s, 410 μm/s, and 350 μm/s, respectively. The red arrow represents the moving direction. See Visualization 4 (clips 1–3) for more details. (e) Maximum velocity of the micro-gear versus light pattern’s thickness, and the error bars represent the standard deviation for five replicates. The velocity refers to the velocity of micro-gears in the horizontal direction. (f)–(h) Microscope images showing the escape of a micro-gear from an OET trap with flipping behavior. See Visualization 4 (clip 4) for more details.


Set citation alerts for the article
Please enter your email address

© Copyright 2018-2021 | Chinese Laser Press. All Rights Reserved 沪ICP备15018463号-20