• Acta Optica Sinica
  • Vol. 39, Issue 5, 0504002 (2019)
Hongyu Lin1、2, Hao Xie1、2, Yang Wang1、2, Hongbo Lu1、2, Yan Sun1, Shuhong Hu1、*, Xin Chen1, and Ning Dai1、*
Author Affiliations
  • 1 State Key Laboratory of Infrared Physics, Shanghai Institute of Technical Physics, Chinese Academy of Sciences, Shanghai 200083, China
  • 2 University of Chinese Academy of Sciences, Beijing 100049, China
  • show less
    DOI: 10.3788/AOS201939.0504002 Cite this Article Set citation alerts
    Hongyu Lin, Hao Xie, Yang Wang, Hongbo Lu, Yan Sun, Shuhong Hu, Xin Chen, Ning Dai. Modeling of InAsSbP Blocking Barrier Grown by Liquid-Phase Epitaxy in InAs-Based Infrared Photodetector[J]. Acta Optica Sinica, 2019, 39(5): 0504002 Copy Citation Text show less
    Structure of InAs-based infrared detector
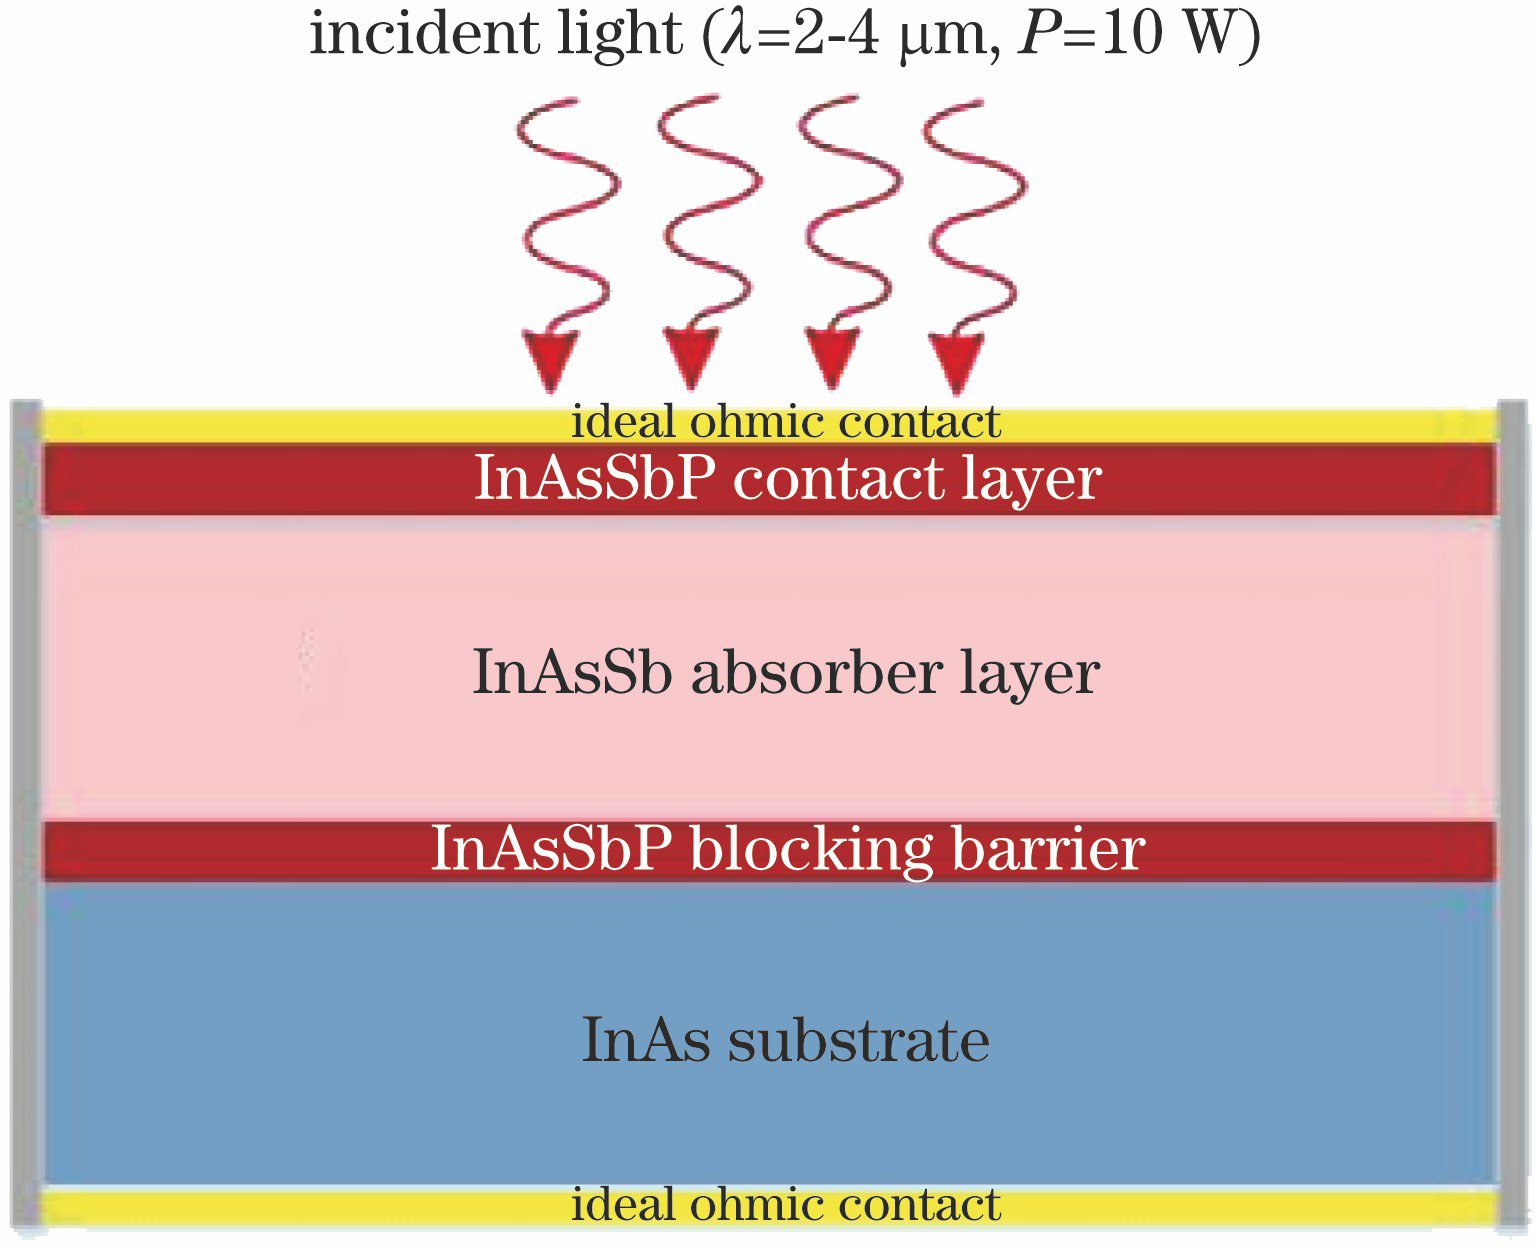
    Fig. 1. Structure of InAs-based infrared detector
    Simulated energy band diagrams of different device structures with InAsSbP blocking barrier. (a) nBip structure; (b) pBin structure; (c) nBn structure
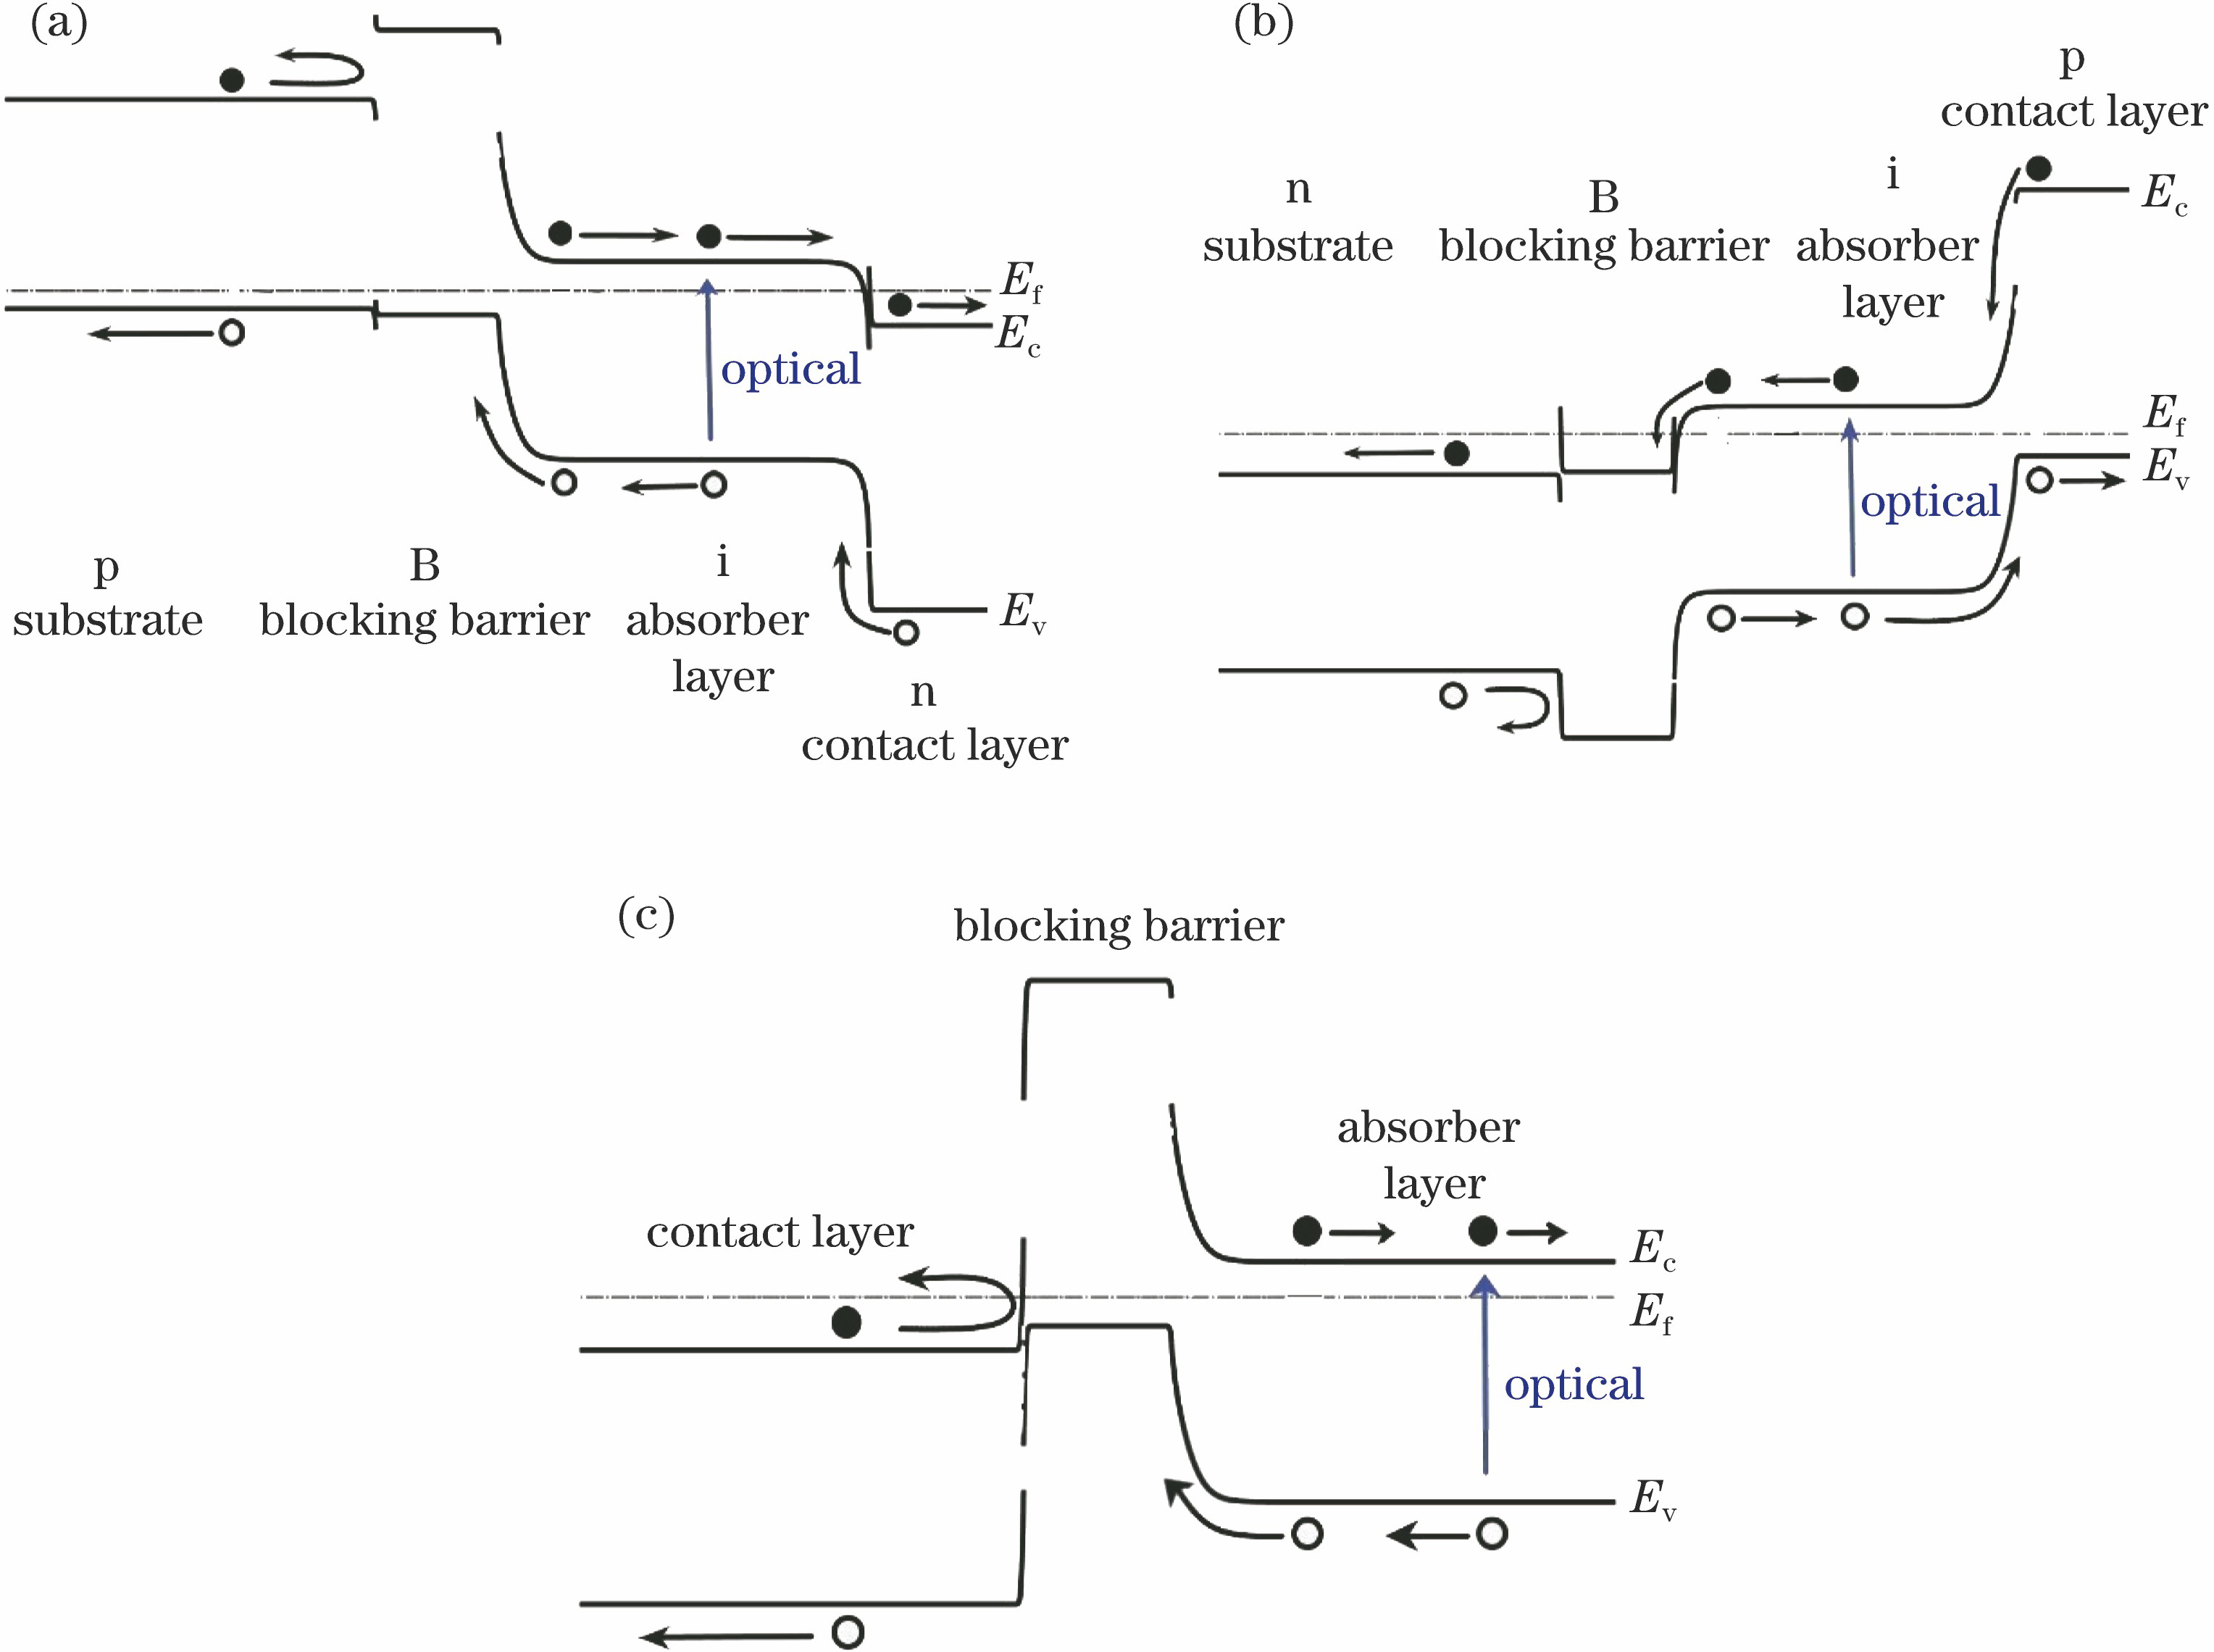
    Fig. 2. Simulated energy band diagrams of different device structures with InAsSbP blocking barrier. (a) nBip structure; (b) pBin structure; (c) nBn structure
    Normalized on-off ratio versus bandgap of blocking barrier for pBin detector
    Fig. 3. Normalized on-off ratio versus bandgap of blocking barrier for pBin detector
    Normalized on-off ratio versus thickness of blocking barrier for different device structures. (a) nBip structure; (b) pBin structure
    Fig. 4. Normalized on-off ratio versus thickness of blocking barrier for different device structures. (a) nBip structure; (b) pBin structure
    Normalized on-off ratio versus doping concentration of blocking barrier for different device structures. (a) nBip structure; (b) pBin structure
    Fig. 5. Normalized on-off ratio versus doping concentration of blocking barrier for different device structures. (a) nBip structure; (b) pBin structure
    Simulated energy band diagrams of nBip detector with doping concentration deviating from optimum value. (a) Lower than optimum value; (b) higher than optimum value
    Fig. 6. Simulated energy band diagrams of nBip detector with doping concentration deviating from optimum value. (a) Lower than optimum value; (b) higher than optimum value
    Simulated energy band diagrams of pBin detector with doping concentration deviating from optimum value. (a) Lower than optimum value; (b) higher than optimum value
    Fig. 7. Simulated energy band diagrams of pBin detector with doping concentration deviating from optimum value. (a) Lower than optimum value; (b) higher than optimum value
    StructureThickness /μmDoping typeDoping concentration
    Na /cm-3Nd /cm-3
    Substrate (InAs)500p+2×10¹⁸
    n+2×10¹⁸
    Blocking barrier (InAsSbP)0.01-0.5p+1×10¹⁶-7×10¹⁸
    n+1×10¹⁶-1×10¹⁹
    Absorption layer (InAs0.89Sb0.11)3Intrinsic (n-)1.5×10¹⁶
    Contact layer (InAsSbP)0.5p+1×10¹⁷
    n+1×10¹⁷
    Table 1. Basic materials and structural parameters of InAs-based detector
    Hongyu Lin, Hao Xie, Yang Wang, Hongbo Lu, Yan Sun, Shuhong Hu, Xin Chen, Ning Dai. Modeling of InAsSbP Blocking Barrier Grown by Liquid-Phase Epitaxy in InAs-Based Infrared Photodetector[J]. Acta Optica Sinica, 2019, 39(5): 0504002
    Download Citation