
Qianhong Cai, Yuhong Liu, Rongfen Zhang. Two-Stage Retinal Vessel Segmentation Based on Improved U-Net[J]. Laser & Optoelectronics Progress, 2021, 58(16): 1617002
- Laser & Optoelectronics Progress
- Vol. 58, Issue 16, 1617002 (2021)
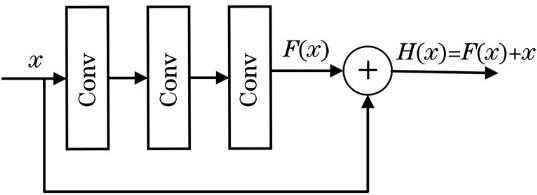
Fig. 1. Residual block
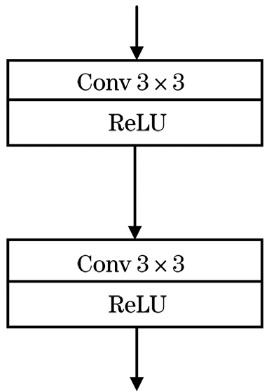
Fig. 2. Original U-Net codec module
Fig. 3. U-Net codec module with residual block
Fig. 4. Schematic of attention module
Fig. 5. AttResU-Net and Mini-AttResU-Net network structure diagrams
Fig. 6. Flow chart of retinal vessel segmentation
Fig. 7. Fundus image channel comparison maps. (a) RGB original image; (b) red channel; (c) green channel; (d) blue channel
Fig. 8. Image preprocessing. (a) Original color image; (b) original image after extracting the green channel; (c) image after CLAHE operation; (d) after rotating 90°; (e) after rotating 180°; (f) after rotating 270°; (g) after horizontal flip; (h) after vertical flip
Fig. 9. Segmentation results of proposed method on DRIVE database. (a) Original images; (b) ground truth images; (c) segmentation images
Fig. 10. Segmentation results of proposed method on STARE database. (a) Original images; (b) ground truth images; (c) segmentation images
Fig. 11. Local segmentation maps. (a) Original fundus images; (b) partial color fundus maps; (c) standard partial segmentation maps; (d) ours local segmentation maps
Fig. 12. Segmentation results of different methods on DRIVE database
Fig. 13. Segmentation results of different methods on STARE database
|
Table 1. Performance comparison of different segmentation methods based on U-Net network
|
Table 2. Performance indicators of different methods in DRIVE database
|
Table 3. Performance indicators of different methods in STARE database
| ||||||||||||||||||||||
Table 4. Comparison of inference time of different methods on two databases

Set citation alerts for the article
Please enter your email address
© Copyright 2018-2021 | Chinese Laser Press. All Rights Reserved 沪ICP备15018463号-20