• Laser & Optoelectronics Progress
  • Vol. 59, Issue 8, 0811002 (2022)
Zhu Liu1、2, Qi Peng1、2、*, Ge Ren1、2, Chunsheng Xiang1、2, and Yufeng Tan1、2
Author Affiliations
  • 1Key Laboratory of Optical Engineering, Institute of Optics and Electronics, Chinese Academy of Sciences, Chengdu , Sichuan 610209, China
  • 2University of Chinese Academy of Sciences, Beijing 100049, China
  • show less
    DOI: 10.3788/LOP202259.0811002 Cite this Article Set citation alerts
    Zhu Liu, Qi Peng, Ge Ren, Chunsheng Xiang, Yufeng Tan. Second-Order Sensitivity Matrix Method for Aligning Off-Axis Telescopes[J]. Laser & Optoelectronics Progress, 2022, 59(8): 0811002 Copy Citation Text show less
    Shaded model of off-axis optical system
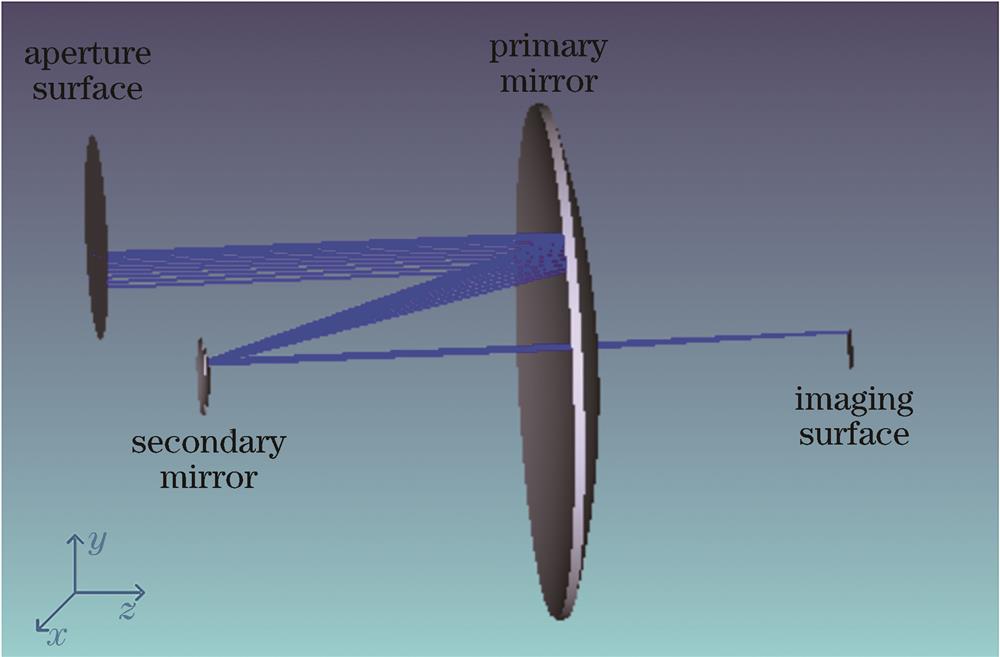
    Fig. 1. Shaded model of off-axis optical system
    Relationship curve between Zernike coefficients and different misalignments. (a) X-axis decenter error; (b) x-axis tilt error; (c) y-axis decenter error; (d) y-axis tilt error
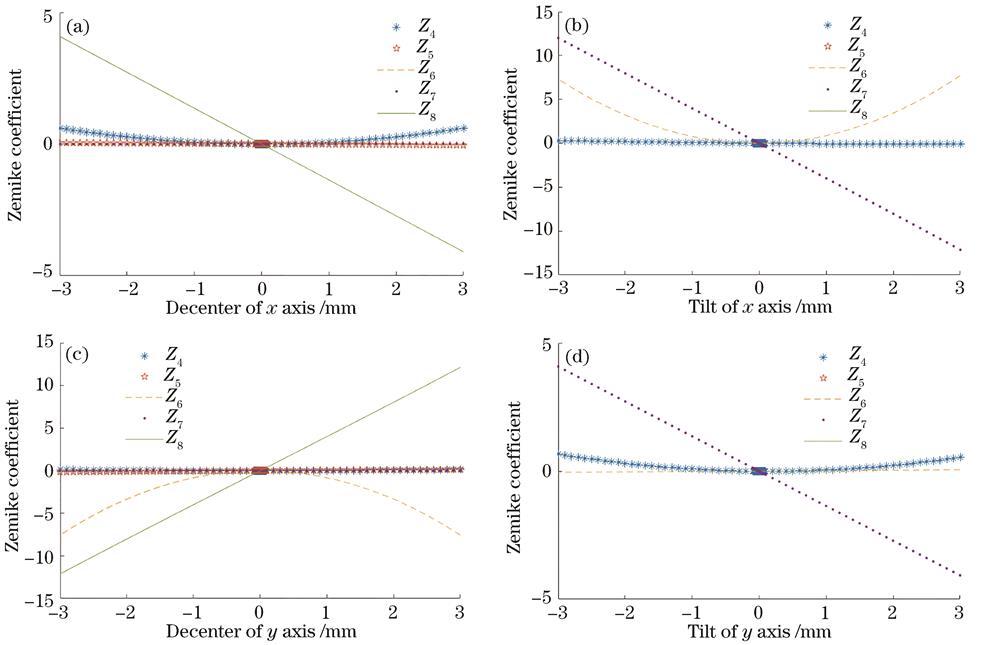
    Fig. 2. Relationship curve between Zernike coefficients and different misalignments. (a) X-axis decenter error; (b) x-axis tilt error; (c) y-axis decenter error; (d) y-axis tilt error
    Fig. 2 expanded graph of the curve affected greatly. (a) Relationship curve between Z4, Z8 and x-axis decenter; (b) relationship curve between Z4, Z7 and y-axis decenter; (c) relationship curve between Z6, Z7 and x-axis tilt; (d) relationship curve between Z6, Z8 and y-axis tilt
    Fig. 3. Fig. 2 expanded graph of the curve affected greatly. (a) Relationship curve between Z4, Z8 and x-axis decenter; (b) relationship curve between Z4, Z7 and y-axis decenter; (c) relationship curve between Z6, Z7 and x-axis tilt; (d) relationship curve between Z6, Z8 and y-axis tilt
    ItemRadius /mmSemi-diameter /mmThickness /mmConic
    Aperture31615000
    Primary mirror-2668.8800-1166.35-1
    Secondary mirror-336.11201200-1
    Table 1. Parameters of off-axis optical system
    ItemFig. 3(a)Fig. 3(b)Fig. 3(c)Fig. 3(d)
    Z4Z8Z6Z7Z4Z7Z6Z8
    Goodness of fit0.9980.9970.9930.9960.9970.9970.9940.995
    Table 2. Goodness of curve fitting
    Group No.XADE /mmYADE /mmXATE /mradYATE /mrad
    AVCVAVCVAVCVAVCV
    13.03.6633-2.9-3.40423.03.66132.73.0248
    22.83.32781.71.34062.32.26922.11.9371
    31.61.24681.30.8823-1.6-1.23891.41.0186
    4-0.7-0.4704-0.8-0.54571.10.74560.80.5263
    50.20.30170.30.3214-0.5-0.3780.40.3478
    Table 3. Difference between actual value and calculate value by traditional method
    Group No.XADE /mmYADE /mmXATE /mradYATE /mrad
    AVCVAVCVAVCVAVCV
    13.02.9999-2.9-2.89743.03.00722.72.7007
    22.82.79981.71.69622.32.29742.12.0968
    31.61.59971.31.2922-1.6-1.60131.41.3966
    4-0.7-0.6998-0.8-0.79721.11.06170.80.7997
    50.20.20030.30.3011-0.5-0.50670.40.4052
    Table 4. Difference between actual value and calculate value by new method
    MethodX-axis decenter error /mmY-axis decenter error /mmX-axis tilt error /mradY-axis tilt error /mrad
    Traditional method0.42580.3530.37660.2665
    New method0.00230.00430.01770.0031
    Table 5. Comparison of accuracy between two methods
    Type of misalignmentGroup No.Actual valueTraditional methodNew method
    Calculate valueErrorCalculate valueError
    X-axis decenter error /mm14.06.30122.30124.00380.0038
    25.09.68604.6865.00510.0051
    36.013.82557.82556.00700.007
    Y-axis decenter error /mm13.75.56841.86843.6177-0.0823
    2-5.2-10.0917-4.8917-5.2823-0.0823
    36.315.91329.61326.2126-0.0838
    X-axis tilt error /mrad1-3.8-5.7484-1.9484-3.8186-0.0186
    24.78.65593.95594.73050.0305
    35.612.3046.7045.68010.0801
    Y-axis tilt error /mrad13.03.67010.67013.00290.0029
    24.47.66103.2614.43290.0329
    3-6.1-14.7609-8.6609-6.2079-0.1079
    Table 6. Accuracy difference between traditional method and new method
    Zhu Liu, Qi Peng, Ge Ren, Chunsheng Xiang, Yufeng Tan. Second-Order Sensitivity Matrix Method for Aligning Off-Axis Telescopes[J]. Laser & Optoelectronics Progress, 2022, 59(8): 0811002
    Download Citation