• Acta Optica Sinica
  • Vol. 42, Issue 9, 0901002 (2022)
Chenxiang Qiu1、2、3, Zaihong Hou1、3, Xu Jing1、3、*, Feng He1、3, and Silong Zhang1、3
Author Affiliations
  • 1Key Laboratory of Atmospheric Optics, Anhui Institute of Optics and Fine Mechanics, Hefei Institutes of Physical Science, Chinese Academy of Sciences, Hefei 230031, Anhui, China
  • 2Science Island Branch of Graduate School, University of Science and Technology of China, Hefei 230026, Anhui, China
  • 3Anhui Laboratory of Advanced Laser Technology, Hefei 230037, Anhui, China
  • show less
    DOI: 10.3788/AOS202242.0901002 Cite this Article Set citation alerts
    Chenxiang Qiu, Zaihong Hou, Xu Jing, Feng He, Silong Zhang. Turbulence Models and Daily Variations Obtained by Bidirectional Atmospheric Coherent Length Measurements[J]. Acta Optica Sinica, 2022, 42(9): 0901002 Copy Citation Text show less
    Schematic diagram of height interval of slope measurement path
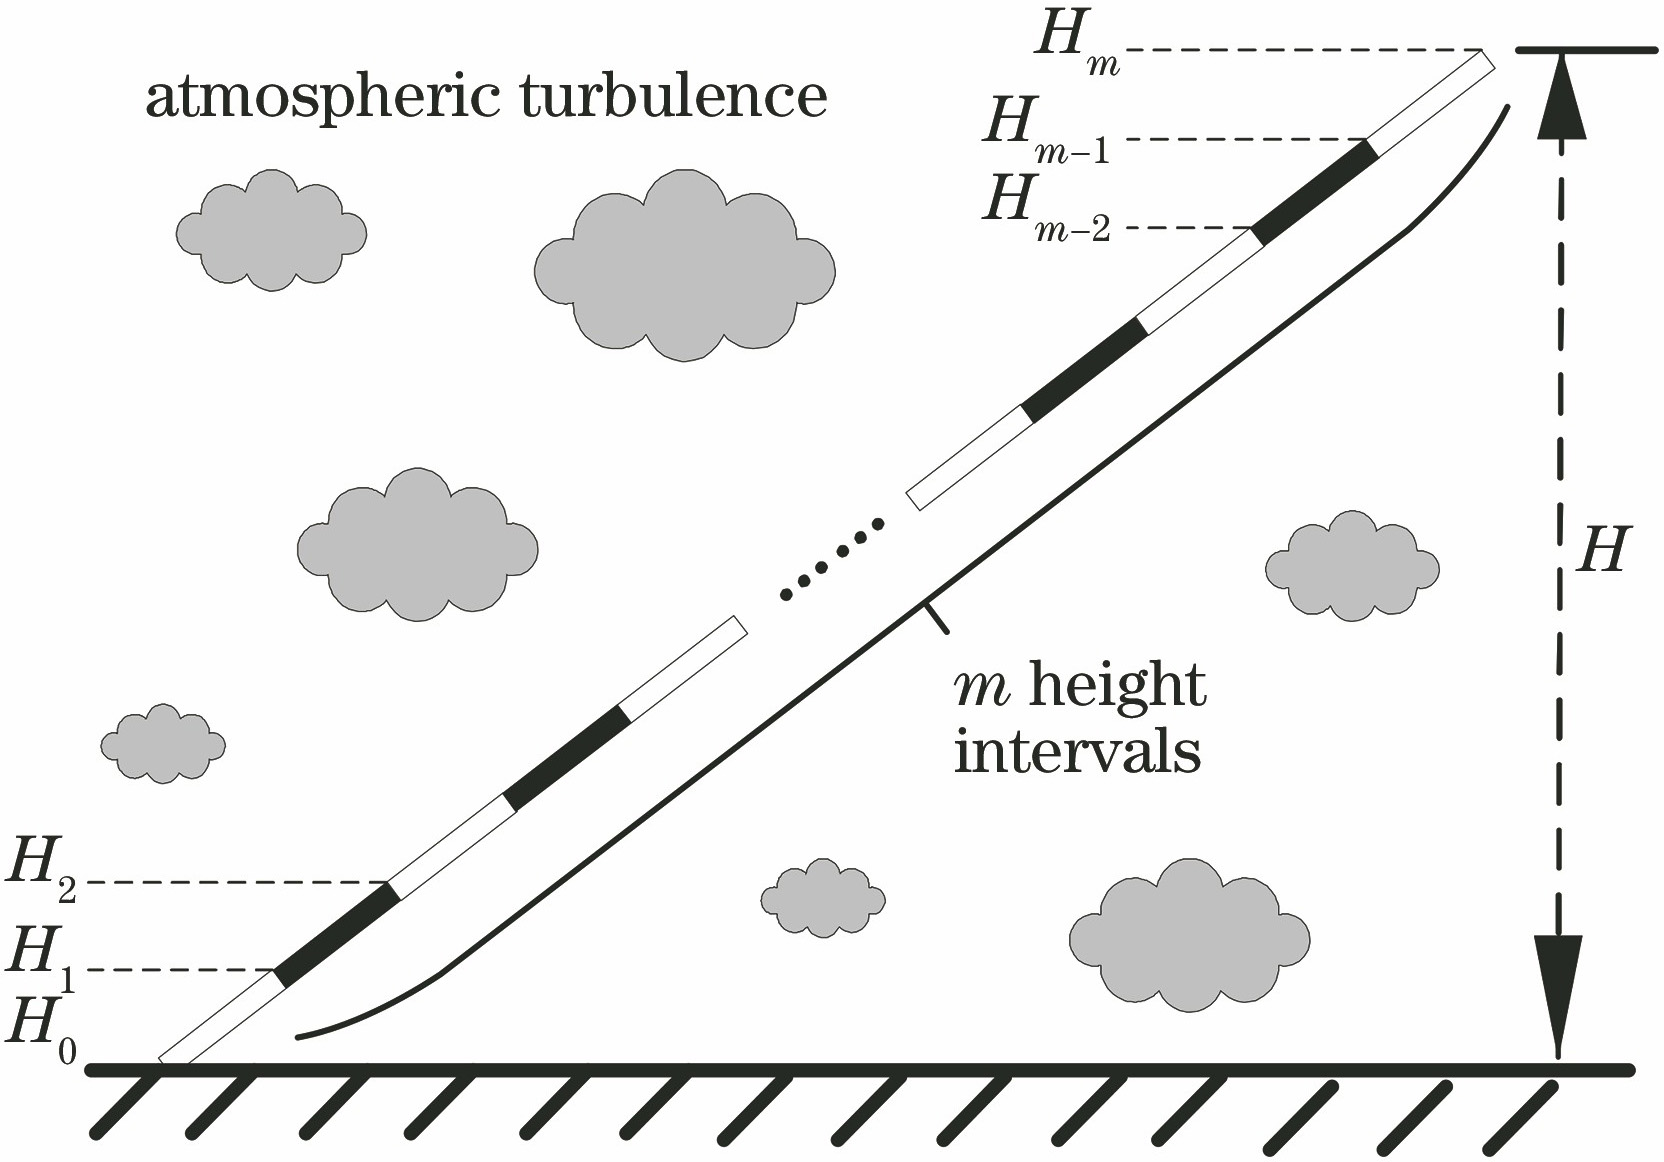
    Fig. 1. Schematic diagram of height interval of slope measurement path
    Schematic diagram of experimental device
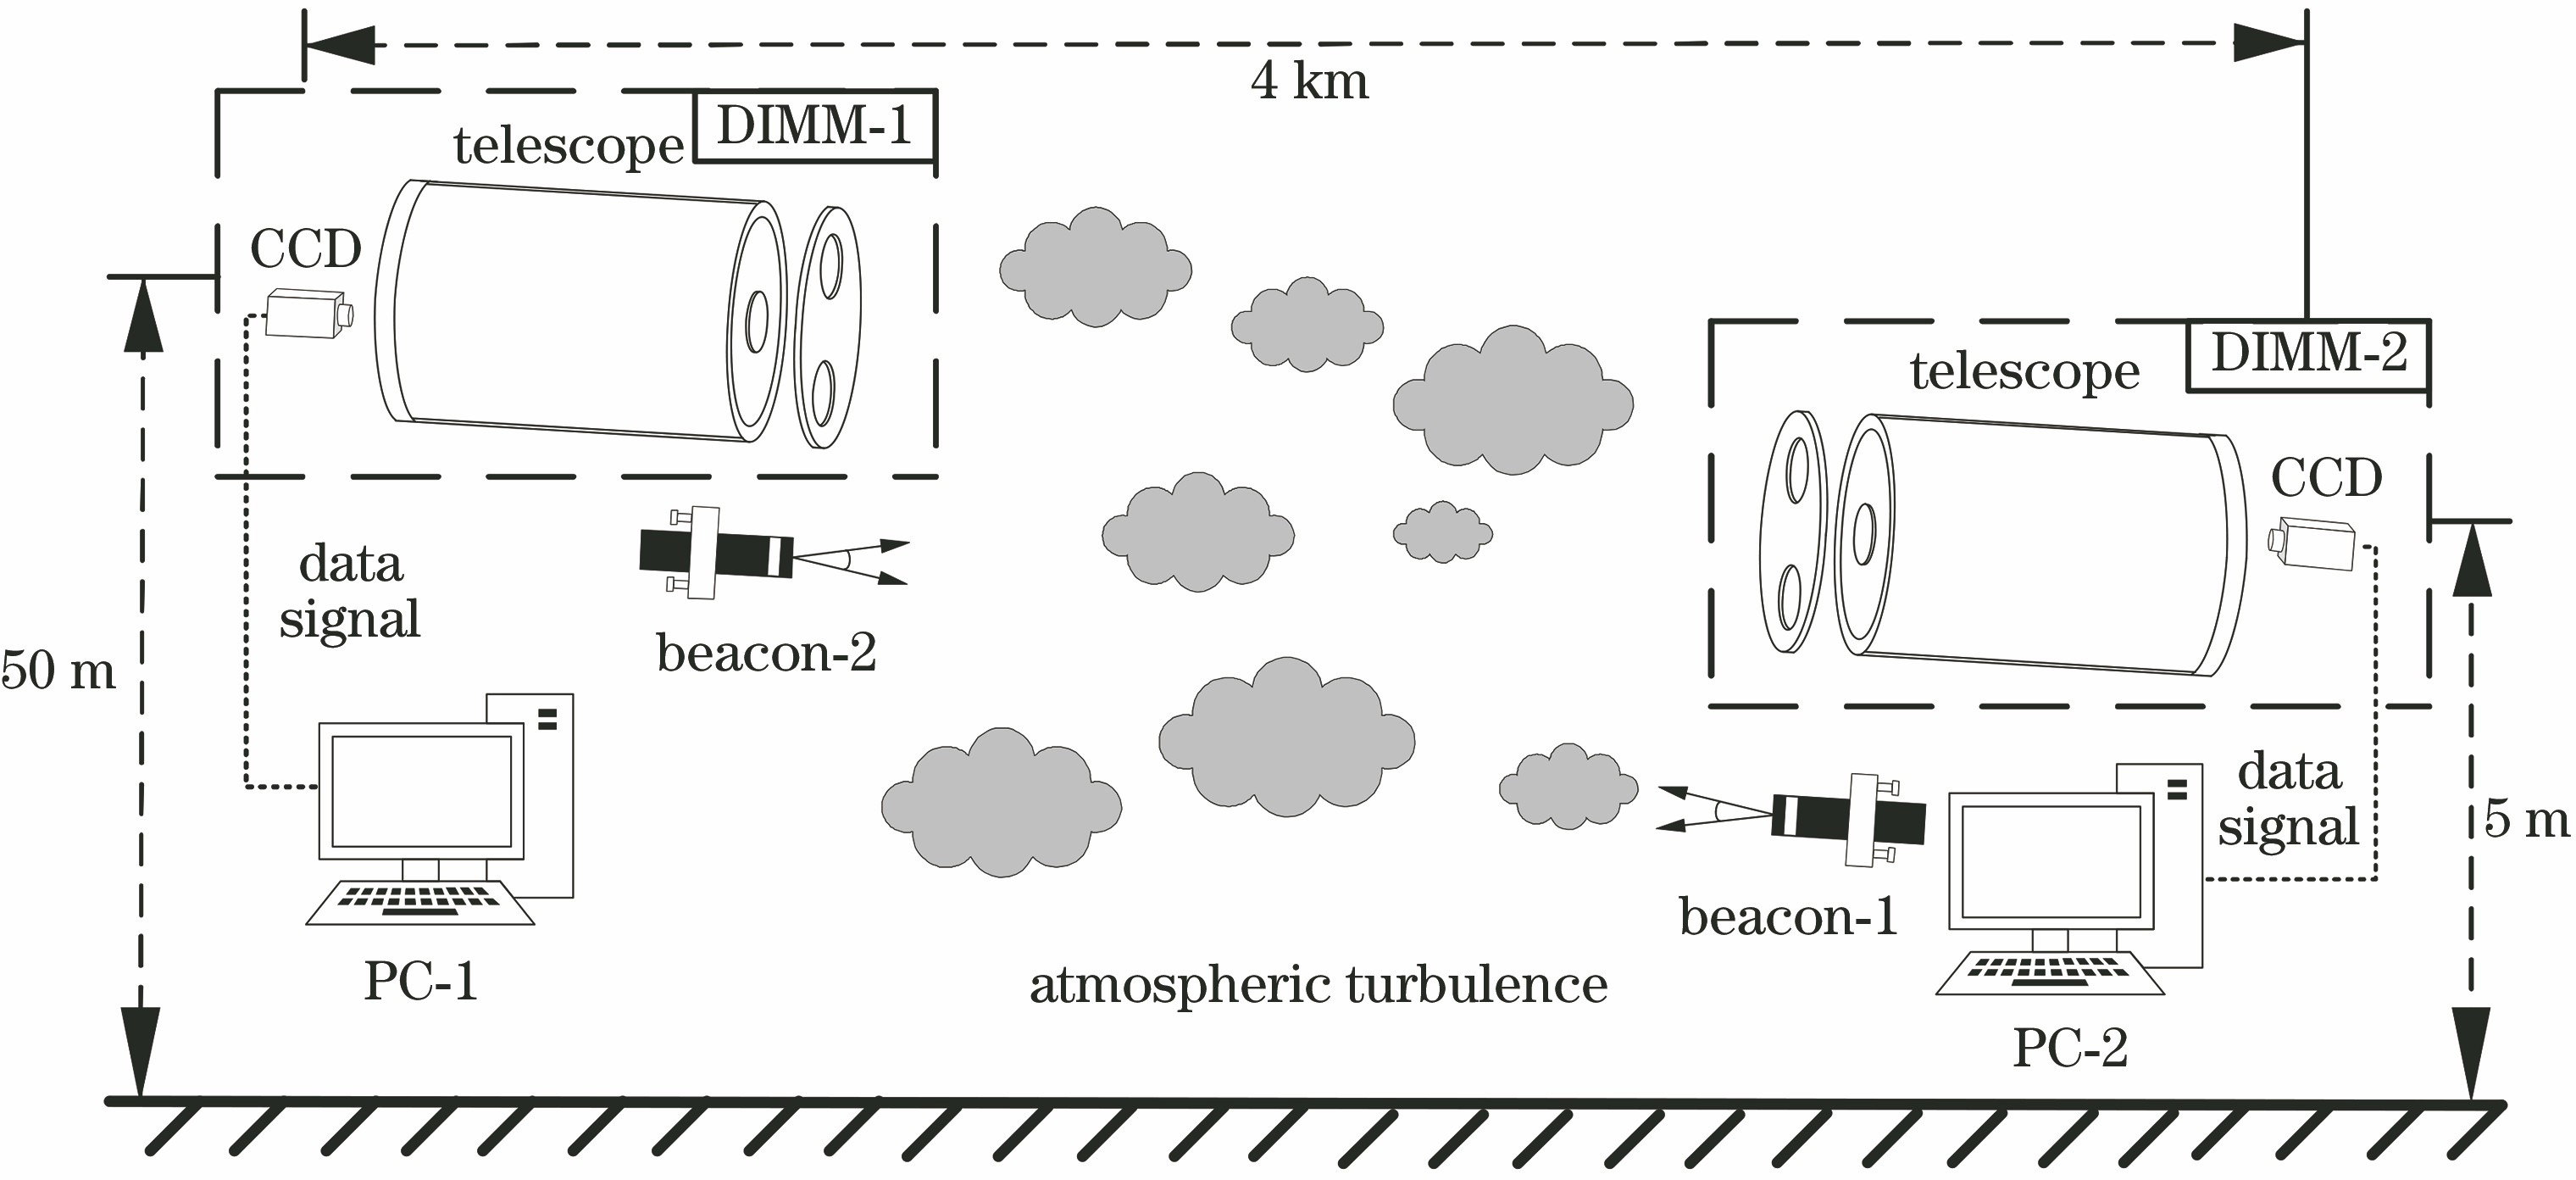
    Fig. 2. Schematic diagram of experimental device
    Daily variation of atmospheric coherence length measurement results
    Fig. 3. Daily variation of atmospheric coherence length measurement results
    Average variation curves of atmospheric coherence length every 10 min (12:00—20:00)
    Fig. 4. Average variation curves of atmospheric coherence length every 10 min (12:00—20:00)
    Spatiotemporal distributions of turbulence intensity along measurement path. (a) Cloudy; (b) sunny
    Fig. 5. Spatiotemporal distributions of turbulence intensity along measurement path. (a) Cloudy; (b) sunny
    Ratio of atmospheric coherence length of same slope path and their exponential fit for single day
    Fig. 6. Ratio of atmospheric coherence length of same slope path and their exponential fit for single day
    Ratio of atmospheric coherence length of same slope path for several days. (a) Scatter diagram; (b) interval statistics diagram
    Fig. 7. Ratio of atmospheric coherence length of same slope path for several days. (a) Scatter diagram; (b) interval statistics diagram
    Chenxiang Qiu, Zaihong Hou, Xu Jing, Feng He, Silong Zhang. Turbulence Models and Daily Variations Obtained by Bidirectional Atmospheric Coherent Length Measurements[J]. Acta Optica Sinica, 2022, 42(9): 0901002
    Download Citation