• Chinese Optics Letters
  • Vol. 19, Issue 6, 060015 (2021)
Xiao-Hui Tian1, Wei Zhou1, Kun-Qian Ren1, Chi Zhang1, Xiaoyue Liu2, Guang-Tai Xue1, Jia-Chen Duan1, Xinlun Cai2, Xiaopeng Hu1, Yan-Xiao Gong1、*, Zhenda Xie1、**, and Shi-Ning Zhu1
Author Affiliations
  • 1National Laboratory of Solid State Microstructures, School of Physics, School of Electronic Science and Engineering, College of Engineering and Applied Sciences, and Collaborative Innovation Center of Advanced Microstructures, Nanjing University, Nanjing 210093, China
  • 2State Key Laboratory of Optoelectronic Materials and Technologies and School of Physics and Engineering, Sun Yat-sen University, Guangzhou 510275, China
  • show less
    DOI: 10.3788/COL202119.060015 Cite this Article Set citation alerts
    Xiao-Hui Tian, Wei Zhou, Kun-Qian Ren, Chi Zhang, Xiaoyue Liu, Guang-Tai Xue, Jia-Chen Duan, Xinlun Cai, Xiaopeng Hu, Yan-Xiao Gong, Zhenda Xie, Shi-Ning Zhu. Effect of dimension variation for second-harmonic generation in lithium niobate on insulator waveguide [Invited][J]. Chinese Optics Letters, 2021, 19(6): 060015 Copy Citation Text show less
    Structure and mode simulation of the LNOI waveguide. (a) Cross-section structure of the LNOI ridge waveguide (H, thickness; W, top width; D, etching depth). Optical mode profiles (energy density) for fundamental TE modes at (b) 1550 nm and (c) 775 nm.
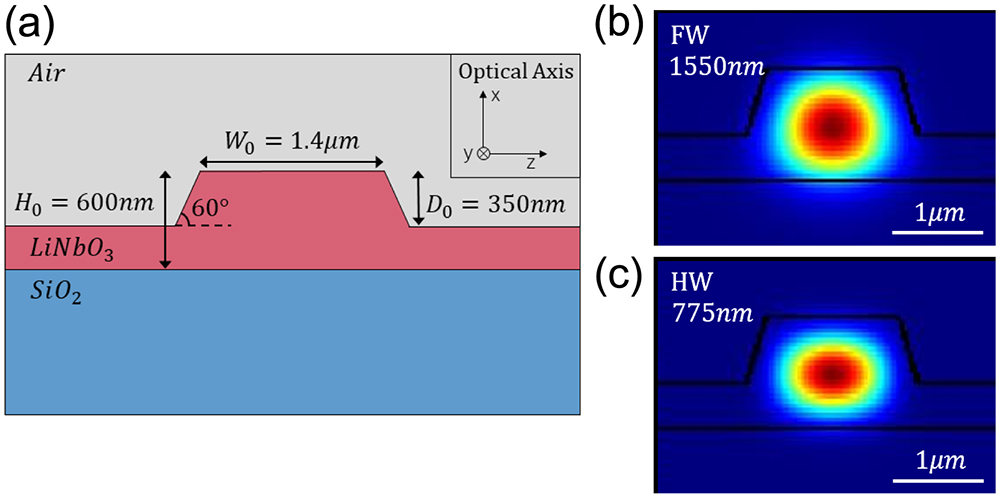
    Fig. 1. Structure and mode simulation of the LNOI waveguide. (a) Cross-section structure of the LNOI ridge waveguide (H, thickness; W, top width; D, etching depth). Optical mode profiles (energy density) for fundamental TE modes at (b) 1550 nm and (c) 775 nm.
    Experiment setup. A continuous-wave (CW) tunable laser serves as the FW source of the SHG process. The output HW light is measured by a high-sensitivity power meter (PM). Two polarizers are inserted to ensure QPM polarization. PC, polarization controller; MMF, multimode fiber.
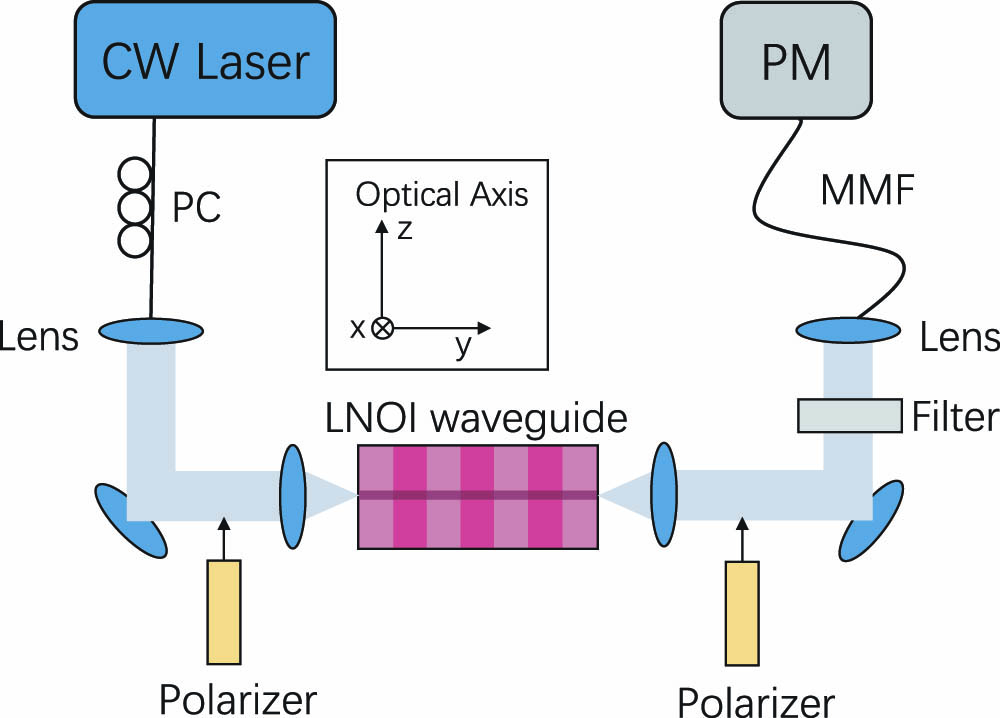
    Fig. 2. Experiment setup. A continuous-wave (CW) tunable laser serves as the FW source of the SHG process. The output HW light is measured by a high-sensitivity power meter (PM). Two polarizers are inserted to ensure QPM polarization. PC, polarization controller; MMF, multimode fiber.
    Experimentally observed spectra (blue curves) from two 6-mm-long waveguides with poling periods of (a) 4.1 µm and (b) 3.9 µm, respectively. The red curves are plotted with sinc-square functions.
    Fig. 3. Experimentally observed spectra (blue curves) from two 6-mm-long waveguides with poling periods of (a) 4.1 µm and (b) 3.9 µm, respectively. The red curves are plotted with sinc-square functions.
    Simulated effective refractive index (Neff) as a function of (a) top width, (b) etching depth, and (c) thickness for all four waves in the waveguide.
    Fig. 4. Simulated effective refractive index (Neff) as a function of (a) top width, (b) etching depth, and (c) thickness for all four waves in the waveguide.
    SHG spectrum profile simulated with optimized gradient thickness change (red curve). The blue curve is the SHG spectrum measured in the experiment.
    Fig. 5. SHG spectrum profile simulated with optimized gradient thickness change (red curve). The blue curve is the SHG spectrum measured in the experiment.
    Xiao-Hui Tian, Wei Zhou, Kun-Qian Ren, Chi Zhang, Xiaoyue Liu, Guang-Tai Xue, Jia-Chen Duan, Xinlun Cai, Xiaopeng Hu, Yan-Xiao Gong, Zhenda Xie, Shi-Ning Zhu. Effect of dimension variation for second-harmonic generation in lithium niobate on insulator waveguide [Invited][J]. Chinese Optics Letters, 2021, 19(6): 060015
    Download Citation