• Journal of Semiconductors
  • Vol. 40, Issue 7, 072902 (2019)
Qiang Li1、2, Ji-Yang Zhou1、2, Zheng-Hao Liu1、2, Jin-Shi Xu1、2, Chuan-Feng Li1、2, and Guang-Can Guo1、2
Author Affiliations
  • 1CAS Key Laboratory of Quantum Information, University of Science and Technology of China, Hefei 230026, China
  • 2CAS Center for Excellence in Quantum Information and Quantum Physics, University of Science and Technology of China, Hefei 230026, China
  • show less
    DOI: 10.1088/1674-4926/40/7/072902 Cite this Article
    Qiang Li, Ji-Yang Zhou, Zheng-Hao Liu, Jin-Shi Xu, Chuan-Feng Li, Guang-Can Guo. Stable single photon sources in the near C-band range above 400 K[J]. Journal of Semiconductors, 2019, 40(7): 072902 Copy Citation Text show less
    (Color online) The experimental setup and the scanning image of the single photon emitter. (a) The experimental setup. The pump laser is focused by an objective to excite the sample mounted on a three-dimension nanopositioner stage. The temperature of the sample is controlled by a heater which is connected to a temperature controller. The emitted photons are filtered and then separated by a beam splitter, which are collected by fiber couplers and detected by superconducting single photon detectors (SSPD). (b) A 10 × 10μm2 confocal scan image on the surface of the sample under 0.5 mW laser excitation. A representative single photon emitter is denoted by the red circle. The scale bar is 1 μm. (c) The photon counts with the use of different long pass filters. (d) The reconstructed spectrum with the assumption of Gaussian distribution. (e) The second-order autocorrelation function of the corresponding SPS measured by the CW laser excitation. The black line is the corrected experimental result and the red line is the theoretical fitting using Eq. (1) with g2(0) = 0.06 ± 0.03. (f) The second-order autocorrelation function of the corresponding SPS under 50 μW pulsed laser excitation with a 76 MHz repetition rate.
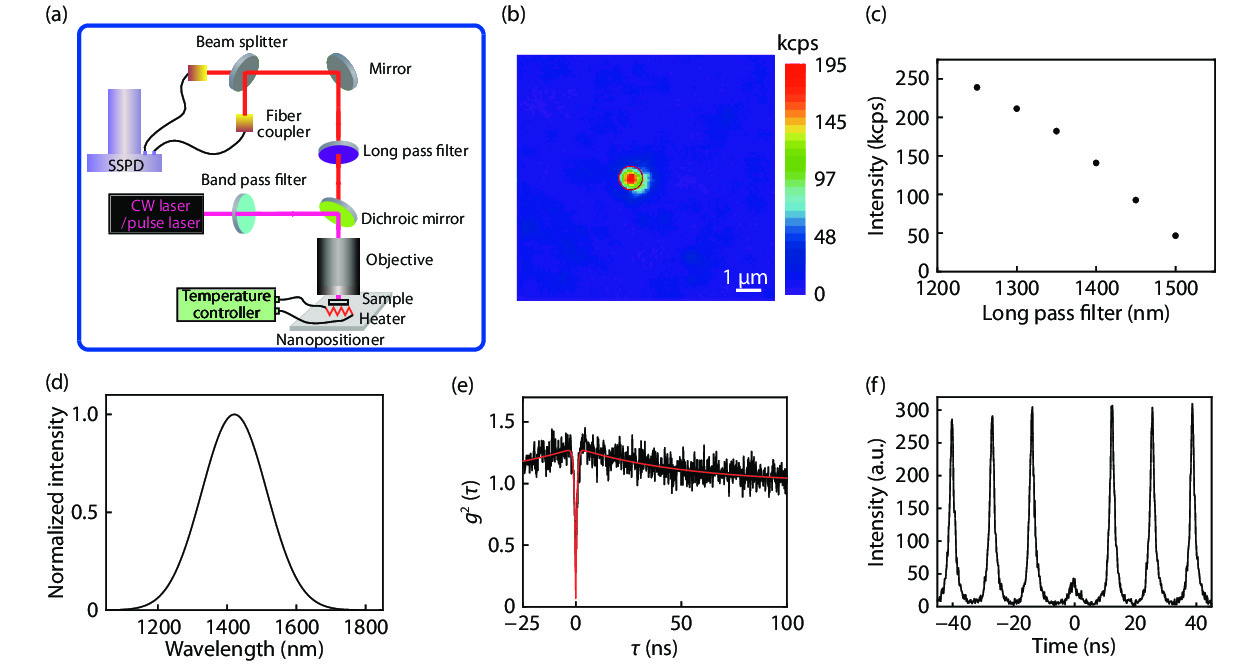
    Fig. 1. (Color online) The experimental setup and the scanning image of the single photon emitter. (a) The experimental setup. The pump laser is focused by an objective to excite the sample mounted on a three-dimension nanopositioner stage. The temperature of the sample is controlled by a heater which is connected to a temperature controller. The emitted photons are filtered and then separated by a beam splitter, which are collected by fiber couplers and detected by superconducting single photon detectors (SSPD). (b) A 10 × 10μm2 confocal scan image on the surface of the sample under 0.5 mW laser excitation. A representative single photon emitter is denoted by the red circle. The scale bar is 1 μm. (c) The photon counts with the use of different long pass filters. (d) The reconstructed spectrum with the assumption of Gaussian distribution. (e) The second-order autocorrelation function of the corresponding SPS measured by the CW laser excitation. The black line is the corrected experimental result and the red line is the theoretical fitting using Eq. (1) with g2(0) = 0.06 ± 0.03. (f) The second-order autocorrelation function of the corresponding SPS under 50 μW pulsed laser excitation with a 76 MHz repetition rate.
    (Color online) Optical properties of the SPS at room temperature. (a) The second-order correlation function g2(τ) at different pump powers. (b) The life-time measurement. The black line is the experimental result and the red line is the single-exponential fitting. (c) The saturation behavior. Black dots are the experimental results and the red line is the theoretical fitting. (d) The stability of the counting rates at different pump power. The sampling time is 0.1 s. No photon bleaching or photon blinking is observed.
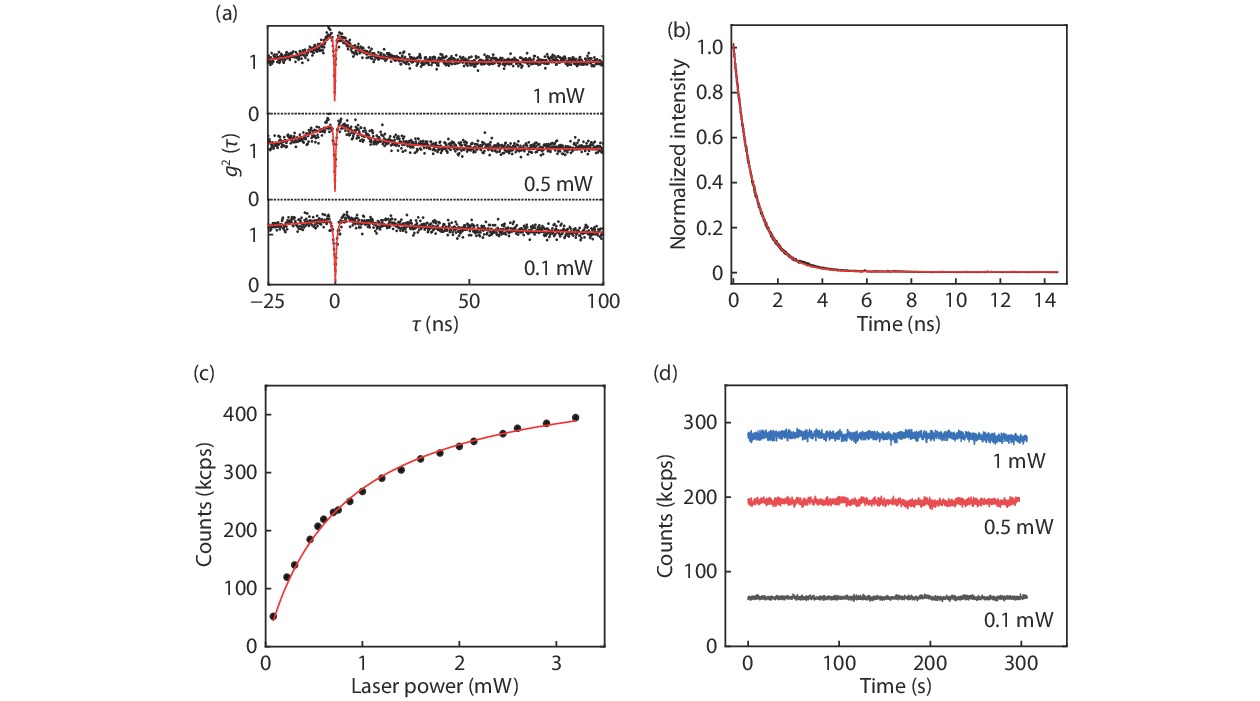
    Fig. 2. (Color online) Optical properties of the SPS at room temperature. (a) The second-order correlation function g2(τ) at different pump powers. (b) The life-time measurement. The black line is the experimental result and the red line is the single-exponential fitting. (c) The saturation behavior. Black dots are the experimental results and the red line is the theoretical fitting. (d) The stability of the counting rates at different pump power. The sampling time is 0.1 s. No photon bleaching or photon blinking is observed.
    (Color online) The optical properties at elevated temperatures. (a) A 20 × 20 μm2 confocal scan image on the surface of the sample under 0.5 mW laser excitation with an objective NA = 0.65. A representative single photon emitter is denoted by the red circle. (b) The photon counts with the use of different long pass filters. (c) The stability of the counting rates at different temperature. The sampling time is 0.1 s. No photon bleaching or photon blinking is observed at even 406 K. (d) The corresponding g2(τ) at the corresponding temperature.
    Fig. 3. (Color online) The optical properties at elevated temperatures. (a) A 20 × 20 μm2 confocal scan image on the surface of the sample under 0.5 mW laser excitation with an objective NA = 0.65. A representative single photon emitter is denoted by the red circle. (b) The photon counts with the use of different long pass filters. (c) The stability of the counting rates at different temperature. The sampling time is 0.1 s. No photon bleaching or photon blinking is observed at even 406 K. (d) The corresponding g2(τ) at the corresponding temperature.
    (Color online) The dependence of lifetime on temperature. (a) The lifetime of the single photon emitter as a function of temperature. With the increase of the temperature, the lifetime almost linearly decreases. (b) The representative lifetime measurements at temperature 343 K.
    Fig. 4. (Color online) The dependence of lifetime on temperature. (a) The lifetime of the single photon emitter as a function of temperature. With the increase of the temperature, the lifetime almost linearly decreases. (b) The representative lifetime measurements at temperature 343 K.
    Qiang Li, Ji-Yang Zhou, Zheng-Hao Liu, Jin-Shi Xu, Chuan-Feng Li, Guang-Can Guo. Stable single photon sources in the near C-band range above 400 K[J]. Journal of Semiconductors, 2019, 40(7): 072902
    Download Citation