• Matter and Radiation at Extremes
  • Vol. 6, Issue 6, 068401 (2021)
Tingting Zhang, Yuechao Wang, Jiawei Xian, Shuaichuang Wang, Jun Fang, Suqing Duan, Xingyu Gao, Haifeng Song, and Haifeng Liua)
Author Affiliations
  • Laboratory of Computational Physics, Institute of Applied Physics and Computational Mathematics, Beijing 100094, China
  • show less
    DOI: 10.1063/5.0059360 Cite this Article
    Tingting Zhang, Yuechao Wang, Jiawei Xian, Shuaichuang Wang, Jun Fang, Suqing Duan, Xingyu Gao, Haifeng Song, Haifeng Liu. Effect of the projector augmented wave potentials on the simulation of thermodynamic properties of vanadium[J]. Matter and Radiation at Extremes, 2021, 6(6): 068401 Copy Citation Text show less
    PAW results compared with FP-LAPW results. (a) Pressure of bcc vanadium as a function of volume. The black diamonds and crosses are the FP-LAPW results and the data from Young et al.,53 respectively. (b) Relative deviation of the pressure Ri as a function of volume. The PAW results are represented by colored symbols and lines, with blue, dark cyan, and red lines with closed symbols indicating the results using PBE-V, PBE-V_pv, and PBE-V_sv, respectively. The black dashed line is zero, corresponding to the FP-LAPW results in (a). (c) PAW results (colored lines) compared with FP-LAPW results with (green open circles) and without (purple closed squares) 3s3p electrons treated as core electrons.
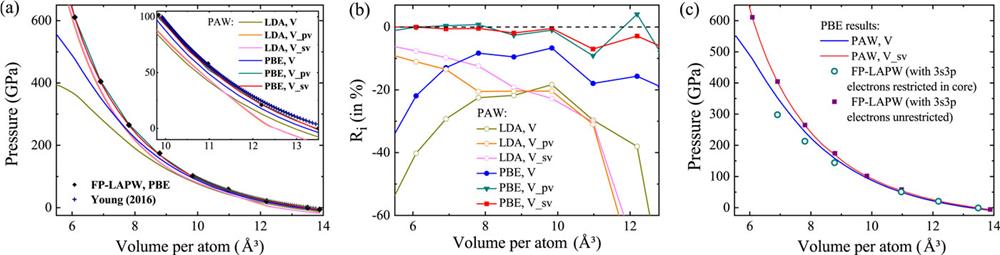
    Fig. 1. PAW results compared with FP-LAPW results. (a) Pressure of bcc vanadium as a function of volume. The black diamonds and crosses are the FP-LAPW results and the data from Young et al.,53 respectively. (b) Relative deviation of the pressure Ri as a function of volume. The PAW results are represented by colored symbols and lines, with blue, dark cyan, and red lines with closed symbols indicating the results using PBE-V, PBE-V_pv, and PBE-V_sv, respectively. The black dashed line is zero, corresponding to the FP-LAPW results in (a). (c) PAW results (colored lines) compared with FP-LAPW results with (green open circles) and without (purple closed squares) 3s3p electrons treated as core electrons.
    Comparisons of the calculated energy bands and DOS between two PAW potentials V and V_sv at volumes (a) 9.84 Å3 and (b) 6.91 Å3.
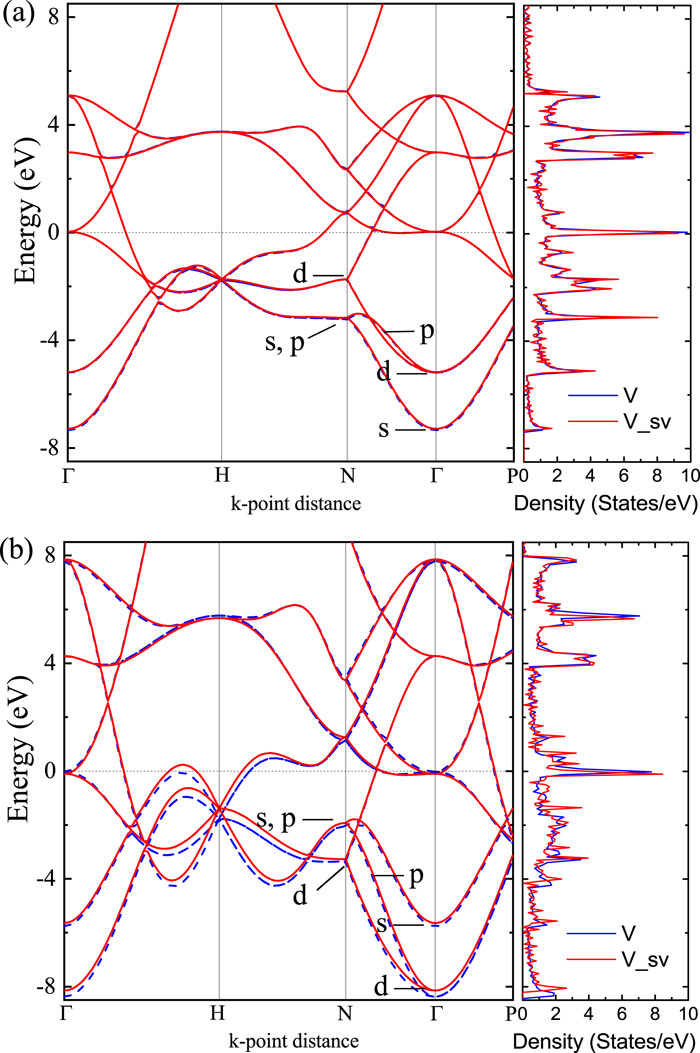
    Fig. 2. Comparisons of the calculated energy bands and DOS between two PAW potentials V and V_sv at volumes (a) 9.84 Å3 and (b) 6.91 Å3.
    Comparison of the potentials and forces obtained using the two PAW potentials V and V_sv.
    Fig. 3. Comparison of the potentials and forces obtained using the two PAW potentials V and V_sv.
    Charge density difference of the [110] planes in the bcc lattice described by the PAW potentials V and V_sv. The warmer (colder) the color, the higher (lower) is the electron density in that region. The gray circles indicate the positions of the atoms.
    Fig. 4. Charge density difference of the [110] planes in the bcc lattice described by the PAW potentials V and V_sv. The warmer (colder) the color, the higher (lower) is the electron density in that region. The gray circles indicate the positions of the atoms.
    (a)–(c) Comparisons of isochoric curves between the potentials V (black squares) and V_sv (red circles) at volumes (a) 12.84 Å3, (b) 9.84 Å3, and (c) 6.91 Å3. The blue diamonds and green triangles indicate our coexistence results24 and the Z-method results from Errandonea et al.,25 respectively. (d) Pressure difference as a function of temperature at each volume. Symbold in different colors indicate systems in different volumes (the straight lines are to guide the eye).
    Fig. 5. (a)–(c) Comparisons of isochoric curves between the potentials V (black squares) and V_sv (red circles) at volumes (a) 12.84 Å3, (b) 9.84 Å3, and (c) 6.91 Å3. The blue diamonds and green triangles indicate our coexistence results24 and the Z-method results from Errandonea et al.,25 respectively. (d) Pressure difference as a function of temperature at each volume. Symbold in different colors indicate systems in different volumes (the straight lines are to guide the eye).
    Comparison of VDOS obtained using the potentials V (dashed lines) and V_sv (solid lines) at volumes (a) 9.84 Å3 and (b) 6.91 Å3.
    Fig. 6. Comparison of VDOS obtained using the potentials V (dashed lines) and V_sv (solid lines) at volumes (a) 9.84 Å3 and (b) 6.91 Å3.
    Tingting Zhang, Yuechao Wang, Jiawei Xian, Shuaichuang Wang, Jun Fang, Suqing Duan, Xingyu Gao, Haifeng Song, Haifeng Liu. Effect of the projector augmented wave potentials on the simulation of thermodynamic properties of vanadium[J]. Matter and Radiation at Extremes, 2021, 6(6): 068401
    Download Citation