
Tingting Zhang, Yuechao Wang, Jiawei Xian, Shuaichuang Wang, Jun Fang, Suqing Duan, Xingyu Gao, Haifeng Song, Haifeng Liu. Effect of the projector augmented wave potentials on the simulation of thermodynamic properties of vanadium[J]. Matter and Radiation at Extremes, 2021, 6(6): 068401
- Matter and Radiation at Extremes
- Vol. 6, Issue 6, 068401 (2021)
Abstract
I. INTRODUCTION
The properties of materials under extreme conditions are of fundamental importance in many areas of science and engineering.1–4Ab initio methods based on density functional theory (DFT)5,6 have played a key role in the study of matter under high pressure. Among these, the projector augmented wave (PAW) method7,8 developed by Blöchl has been widely used for high-throughput ab initio DFT studies, and has been implemented in many codes.9–12 In the PAW method, core electrons are “frozen” and replaced by a pseudopotential to obtain a PAW potential. There are various versions of PAW potentials, differing in the ways in which they treat valence electrons. We take as the standard PAW potential the one that treats only the outermost electrons as valence electrons. Other types of PAW potential can be regarded as extended versions of this standard potential.
The PAW potential is crucial to the accuracy of calculations,13 and it therefore needs to be selected with care. There have been a number of detailed comparative studies, including error analyses, of multiple methods, including a PAW method for ground-state elemental crystals.14–16 Some studies have also tested and optimized PAW datasets for rare-earth elements17 and transition metals.18 In these studies, the tests on the PAW potentials have been carried out at zero temperature or ambient pressure, thereby providing guidance for calculations under nonextreme conditions. However, under high pressure, the electronic structure of a material may change significantly compared with that under ambient pressure. One effect that has been recognized is that the transfer of conduction electrons between the s–p states and d states depends on the degree of compression and varies among crystal structures.19–21 The conduction electrons are closely related to the structural stability of a material. For most 3d transition metals, although the standard potential can give reasonable results at low pressure, it should be used with the uttermost care in high-pressure calculations.22 Using a PAW potential that cannot correctly describe the distribution of electrons when a material is compressed will predict erroneous thermodynamic properties under high pressure. Therefore, choosing a version with semicore electrons also included in the valence states is much safer.
However, in practical applications, besides accuracy, computational efficiency is also a crucial issue that must be taken into account. Especially when faced with large-scale computing tasks, such as ab initio molecular dynamics (AIMD) simulations of the melting of transition materials, we must strike a balance between accuracy and efficiency, and sometimes have to choose the cheapest method within a certain tolerance of errors. Taking the melting simulation of vanadium as an example, it is much cheaper to choose the PAW potential containing only five valence electrons (labeled V) than the version containing 13 valence electrons (labeled V_sv). Thus, the PAW potential V should also be tested as a candidate. Up to now, V_sv has been consistently used in DFT simulations of vanadium under high pressures.23–27 However, there have been few systematic tests of the performance of the V potential or discussions of the influence of the different PAW potentials for vanadium on simulations under extreme conditions. The effects of semicore electrons on the calculation of high-pressure thermodynamic properties of vanadium remain unclear, and there is as yet no definitive standard choice of PAW potential for simulation under high pressure.
In this work, the effects of different PAW potentials on the simulation of thermodynamic properties of vanadium under high pressure are investigated. Comparisons of various properties calculated using different PAW potentials are performed. In particular, the capability of the potential V at increased pressures is systematically tested by comparing its results with those from V_sv. Our purpose is to elucidate the origin of the differences between the results obtained with the different PAW potentials and finally to recommend a procedure for testing these potentials to guarantee reasonable results for thermodynamic properties of materials under extreme conditions.
The remainder of the paper is organized as follows. A brief introduction to the methods and techniques used in this work is given in Sec. II. Then, in Sec. III, the effects of different PAW potentials on the properties of body-centered cubic (bcc) vanadium simulated at zero temperature (zero-T) (e.g., cell parameters, bulk modulus, zero-T compression isotherm, energy band, and electron state density) and finite temperature (finite-T) (e.g., melting point and vibrational density of states) are comprehensively compared and discussed. Finally, our conclusions are summarized in Sec. IV.
II. TECHNIQUES
In this study, various zero-T and finite-T tests are carried out employing the Vienna Ab initio Simulation Package (VASP).11,28–30 The standard VASP-PAW potential of vanadium, labeled V, contains only five electrons (4s2, 3d3) as valence electrons. If the inner electrons of 3p and 3s3p are also treated as valence electrons, this gives versions with semicore states included, labeled V_pv (3p6, 3d3, and 4s2) and V_sv (3s2, 3p6, 3d3, and 4s2). The cutoff radii of V, V_pv, and V_sv are 1.428, 1.217, and 1.217 Å, respectively. To obtain the all-electrons (AE) results as reference, some calculations are repeated with the full-potential (linearized) augmented plane-wave and local-orbitals (FP-LAPW+lo) method31,32 using the WIEN2k package.33,34
In the zero-T tests, different PAW potentials are tested in two commonly used approximations for the electronic exchange-correlation (XC) functional: the Ceperley–Alder parametrization local density approximation (LDA)35–37 and the Perdew–Burke–Ernzerhof (PBE)38 generalized gradient approximation (GGA).39–41 Each calculation in this part is performed on a primitive bcc cell. The k-point grid is 17 × 17 × 17 for the equilibrium structure, and the number of k-points increases when the spacing between the two atoms is decreased. The cutoff energy is 260 eV for the standard PAW potential V and 360 eV for the semicore potentials V_pv and V_sv. These settings ensure energy convergence to better than 1 meV/atom.
In the finite-T tests, the thermal electronic excitations are included using Mermin’s DFT scheme.42 The melting properties are calculated based on the PBE approach. Some experimental43 and theoretical44,45 studies on the solid–solid phase transition of vanadium show that from ambient pressure to about 300 GPa, the bcc phase is the only stable solid phase of vanadium before melting occurs. Therefore, our melting simulations are performed on bcc cells. Each simulation cell, arranged by conventional cells into 5 × 5 × 5, contains 250 atoms. Only the Γ point in reciprocal space is used, and energy cutoffs are correspondingly the same as those of zero-T calculations.
The AIMD simulations of melting are implemented using the Z method.46,47 To achieve high accuracy, a standard simulation by the Z method needs thousands of atoms and is very time-consuming, especially at high pressures. Since the subject of this paper is the effect on calculations of thermodynamic properties of the use of different PAW potentials, it is sufficient to obtain some rough melting points rather than the exact ones on the phase diagram. A simulation cell containing 250 atoms and a simulation time of 3 ps for each melting simulation are used in this work. For more accurate results on the melting curve of vanadium, see our previous work24 on solid–liquid coexistence simulations and the results of Errandonea et al.25 using the standard Z method.
III. RESULTS AND DISCUSSION
A. Properties at zero temperature
In this subsection, we show a series of zero-T properties of vanadium.
1. Equilibrium volume and bulk modulus
First, different PAW potentials and XC functionals are tested by calculating the zero-pressure properties of bcc vanadium, such as the equilibrium volume V0 and bulk modulus B0. Our results and reference data26,48–52 are listed in Appendix A in the
2. Zero-T compression isotherms
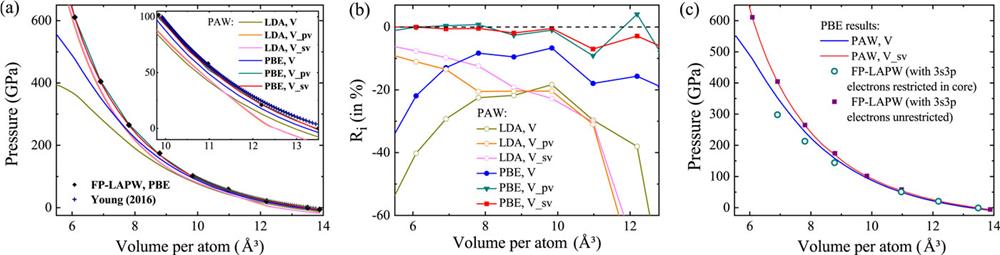
The zero-T compression isotherms of vanadium are calculated to test the performance of the PAW potentials under pressure. The results are plotted in Fig. 1(a) together with the FP-LAPW results and the data from the reference thermodynamic table of Young et al.53 As can be seen from Fig. 1(a), the LDA results differ from those of Young et al. in the low-pressure region. PBE gives better results than LDA. It indicates that the electron distribution of bcc vanadium has a degree of anisotropy and deviates from a uniform electron gas. We therefore focus our attention on the PBE results. To make the contrast more obvious, we define a ratio at each volume, which reflects the relative deviation of the PAW result from the FP-LAPW result:
![]()
Figure 1.PAW results compared with FP-LAPW results. (a) Pressure of bcc vanadium as a function of volume. The black diamonds and crosses are the FP-LAPW results and the data from Young
Since the result from V_pv is close to that from V_sv, in order to simplify the problem and reveal more clearly what is going on, the following comparison is only performed between V and V_sv. As we have mentioned, the main difference between V and V_sv is in the treatment of the valence electrons. To investigate the effect of the valence electrons in the high-pressure calculation, we implement another FP-LAPW calculation, in which the 3s3p electrons are treated as core electrons. As can be seen from Fig. 1(c), the treatment of the 3 s and 3p states has a significant influence on the FP-LAPW calculation: the FP-LAPW result without restriction of 3s3p is very close to the PAW result using V_sv: when the 3s3p electrons are restricted to the core during the FP-LAPW calculation, the slope of the cold pressure curve obtained becomes flatter and closer to the result from the PAW potential V. This indicates that the underestimation of the cold pressure by the PAW potential V is due to the improper definition of the valence electrons of vanadium under high pressure. The inner electrons of 3s3p must also be treated as valence electrons.
3. Energy bands and electronic density of states
The electronic structures of systems under high pressure are also compared between the PAW potentials V and V_sv. The energy bands and the corresponding electronic density of states (DOS) of bcc vanadium at different volumes are calculated along the specific k-points (Γ–H–N–Γ–P) in the Brillouin zone. The results for two volumes, namely, 9.84 and 6.91 Å3, are shown in Fig. 2. Appendix B in the
![]()
Figure 2.Comparisons of the calculated energy bands and DOS between two PAW potentials V and V_sv at volumes (a) 9.84 Å3 and (b) 6.91 Å3.
4. Interatomic force
Besides the different anisotropies in reciprocal space between the V and V_sv results, the difference in local potential polarization is also investigated here. The interatomic forces are calculated using V and V_sv. As can be seen in Fig. 3, below the equilibrium bond length, the potential curve u(r) and corresponding force F(r) obtained using V_sv have steeper slopes than those obtained using V. For systems with the same average interatomic distance r (compressed to the same volume), the probability of collisions between atoms calculated using V_sv is greater than that calculated using V, which results in a higher pressure of the system. This is consistent with the results for the zero-T compression isotherms. The weak force at short range observed in the results from V indicates that the polarization of electrons obtained using V is different from the strong bond-like structure obtained using V_sv.
![]()
Figure 3.Comparison of the potentials and forces obtained using the two PAW potentials V and V_sv.
5. Charge density difference
To further clarify the essential cause of the discrepancies in the results obtained using different PAW potentials, the differences in charge densities are compared, and the results are shown in Appendix C in the
![]()
Figure 4.Charge density difference of the [110] planes in the bcc lattice described by the PAW potentials V and V_sv. The warmer (colder) the color, the higher (lower) is the electron density in that region. The gray circles indicate the positions of the atoms.
B. Properties at finite temperature
In this subsection, several finite-T properties of bcc vanadium at high pressure are calculated using the PAW potentials V and V_sv, and the results are compared.
1. Melting points and thermodynamic properties under high pressure
The high-pressure melting curve is one of the most important properties of vanadium. The results obtained using the PAW potential V are compared with those from previous calculations24,25 using V_sv. Taking the results for volumes of 12.84, 9.84, and 6.91 Å3 as examples, it can be seen from Figs. 5(a)–5(c) that the neighborhood where the isochoric curve bends represents the approximate melting point. The melting pressures and temperatures calculated using V_sv are consistent with the Z-method results from Errandonea et al.25 and our coexistence results.24 However, the melting points calculated using V are very different from these results.
![]()
Figure 5.(a)–(c) Comparisons of isochoric curves between the potentials V (black squares) and V_sv (red circles) at volumes (a) 12.84 Å3, (b) 9.84 Å3, and (c) 6.91 Å3. The blue diamonds and green triangles indicate our coexistence results
In the case of 12.84 Å3 (a volume compression factor of 0.95) [Fig. 5(a)], the melting temperature Tm and pressure Pm calculated using the PAW potential V are already known to be underestimated by about 20%. Hence, it can be seen that, even at low pressures, using V will lead to misleading results for the melting point of vanadium. As the compression ratio continues to increase, the underestimations of Pm and Tm become more pronounced. When the volume is compressed to 6.91 Å3 [Fig. 5(c)], the pressure and temperature at the melting point calculated using V are respectively about 140 GPa and 4000 K lower than those calculated using V_sv. More alarmingly, in this case, the potential V gives an abnormal relationship in which the pressure decreases with increasing temperature, resulting in a melting curve with a zero or even negative slope dTm/dPm at high pressure. According to the Clausius–Clapeyron relation dTm/dPm = Vls/Sls (where Vls is the volume and Sls is the entropy of fusion, which is always positive), the negative slope of the melting curve indicates that the volume of the system is reduced after melting, which contradicts experimental results.25
The calculated thermodynamic quantities are also compared between the two PAW potentials. It can be seen from Fig. 5(d) that for systems of the same volume and temperature, the equilibrium pressures calculated using the potential V are always lower than those calculated using V_sv. This is consistent with the calculated zero-T compression isotherms and is due to the different descriptions of forces in V and V_sv (as shown in Fig. 3).
2. Vibrational density of states
The vibrational density of states (VDOS) is also calculated. The VDOS is defined by the distribution of vibrational normal modes of a system.54 It is the frequency Fourier transform of the velocity autocorrelation function, which can be obtained from temporal trajectories of particles from MD simulations. Figure 6 shows a comparison of the VDOS obtained using the PAW potentials V and V_sv for the same simulation temperatures and volumes. At a temperature of 4000 K, for both cases with volumes of 9.84 and 6.91 Å3, the VDOS given by V_sv still corresponds to the solid state, while the system described by V has already melted. This supports the results from the melting simulation, in which the potential V underestimates the melting point of vanadium under high pressure.
![]()
Figure 6.Comparison of VDOS obtained using the potentials V (dashed lines) and V_sv (solid lines) at volumes (a) 9.84 Å3 and (b) 6.91 Å3.
There is another important phenomenon that needs attention in the VDOS results. It stands to reason that after the system has been compressed from 9.84 to 6.91 Å3, the distribution of atomic vibrational frequencies in reciprocal space should move toward higher frequencies overall, owing to the shortening of the lattice. According to the results from V_sv, after the volume has been compressed, all the peaks move about 200 cm−1 toward higher frequencies. However, the VDOS given by the potential V does not exhibit such behavior. By comparison with the results from V_sv, the interatomic force described by V is weaker, and the atomic vibrational frequency is softer. Thus, it is confirmed that the bonding strength given by V is too weak.
C. Discussion
From the results of the zero-T and finite-T simulations, we have found the following.
First of all, the high-pressure, high-temperature properties of vanadium are sensitive to the choice of PAW potential. Using the PAW potential V will give a cold pressure deviation of over 10%, resulting in an underestimation of the melting point by more than 20% at a given compression ratio. The errors in thermodynamic properties at high temperature and high pressure calculated using different PAW potentials can be predicted by the deviations of the zero-T compression isotherms. We suggest that PAW potentials should first be evaluated by testing zero-T properties under high pressure in the following steps:
Using this procedure, a pseudopotential suitable for simulations under high temperatures and high pressures can be selected.
Second, the energy bands and CDDs reveal that the discrepancies between the PAW potentials arise because of the differences in the definitions of the valence electrons in these potentials. A potential with semicore (3s3p) electrons as valence electrons gives much better results at high pressure from two aspects. On the one hand, at high pressure, the coupling between different electron states is much tighter, and this leads to a more obvious variation of the potential in reciprocal space. The additional semicore electrons provide an extra degree of freedom to enable a more detailed description of the anisotropy of the potential in reciprocal space. This is important for the band dispersion, which in turn affects the metallic properties of the system. On the other hand, the reduced distance between nuclei under high pressure leads to polarization of the distribution of electrons around atoms. The free semicore electrons can contribute to the formation of a local polarized potential, which gives a better description of bonding under high pressure.
The results for the VDOS corroborate the above conclusions. They verify that the insufficient bonding strength described by the potential V causes the melting point under high pressure to be underestimated.
IV. CONCLUSIONS
We have reported simulations of the high-pressure properties of vanadium using different PAW potentials under both zero-T and finite-T conditions. We find that there is no significant distinction between the results from the potentials V_sv and V for equilibrium volume and bulk modulus at zero pressure, but there are striking differences between the results from these potentials for the zero-T compression isotherms and thermodynamic properties at high pressure. The calculations using the potential V badly underestimate the melting points of vanadium, and even give a qualitatively wrong characterization of the melting curve as having negative slope.
The high-pressure electronic structure, charge distribution, and interatomic force at zero temperature have been analyzed to explain the above phenomena. This analysis reveals that the discrepancies in thermodynamic properties calculated using different PAW potentials arise mainly from the differences in the electron dispersion and anisotropy of electronic bonding described by these pseudopotentials. These lead to a significant difference in lattice stability with increasing temperature.
Finally, and most importantly, we have proposed a procedure for testing PAW potentials to ensure that reasonable results are obtained for thermodynamic properties when simulations are performed under extreme conditions.
SUPPLEMENTARY MATERIAL
ACKNOWLEDGMENTS
Acknowledgment. The authors thank Shijie Xiong for valuable suggestions. Our deepest gratitude goes to the editors and the anonymous reviewers for their careful work and thoughtful suggestions that have helped improve this paper substantially. This work is supported by the Science Challenge Project (Grant No. TZ2016001) and the National Natural Science Foundation of China (Grant Nos. U1930401, 51671033, and 12004048). We thank the Tianhe platforms at the National Supercomputer Center in Tianjin and the foundation of LCP.
References
[1] B.Chen, J.Chen, H.-K.Mao et al. Recent advances in high-pressure science and technology. Matter Radiat. Extremes, 1, 59-75(2016).
[2] H.Liu, H.Song, Q.Zhang et al. Validation for equation of state in wide regime: Copper as prototype. Matter Radiat. Extremes, 1, 123(2016).
[3] A. L.Kritcher, M. E.Martin, J.Nilsen et al. Understanding the effects of radiative preheat and self-emission from shock heating on equation of state measurement at 100 s of Mbar using spherically converging shock waves in a NIF hohlraum. Matter Radiat. Extremes, 5, 018401(2020).
[4] X. T.He, W.Kang, H.Wang, P.Zhang, S.Zhang. Extended application of Kohn-Sham first-principles molecular dynamics method with plane wave approximation at high energy—From cold materials to hot dense plasmas. Phys. Plasmas, 23, 042707(2016).
[5] P.Hohenberg, W.Kohn. Inhomogeneous electron gas. Phys. Rev., 136, B864(1964).
[6] W.Kohn, L. J.Sham. Self-consistent equations including exchange and correlation effects. Phys. Rev., 140, A1133(1965).
[7] P. E.Bl?chl. Projector augmented-wave method. Phys. Rev. B, 50, 17953(1994).
[8] P. E.Bl?chl, C. J.F?rst, J.Schimpl. Projector augmented wave method:
[9] R. B.Dunning, N. A. W.Holzwarth, G. E.Matthews, A. R.Tackett, Y.Zeng. Comparison of the projector augmented-wave, pseudopotential, and linearized augmented-plane-wave formalisms for density-functional calculations of solids. Phys. Rev. B, 55, 2005(1997).
[10] N. A. W.Holzwarth, G. E.Matthews, A. R.Tackett. A projector augmented wave (PAW) code for electronic structure calculations, Part II:
[11] D.Joubert, G.Kresse. From ultrasoft pseudopotentials to the projector augmented-wave method. Phys. Rev. B, 59, 1758(1999).
[12] S.Blügel, W.Kromen, K.Schroeder.
[13] F.Bruneval, J.-P.Crocombette, B.Dorado, X.Gonze, F.Jollet, M.Torrent. Consistent treatment of charged systems within periodic boundary conditions: The projector augmented-wave and pseudopotential methods revisited. Phys. Rev. B, 89, 045116(2014).
[14] S.Cottenier, K.Lejaeghere, G.Van Oost, V.Van Speybroeck. Error estimates for solid-state density-functional theory predictions: An overview by means of the ground-state elemental crystals. Crit. Rev. Solid State Mater. Sci., 39, 1-24(2014).
[15] G.Bihlmayer, T.Bj?rkman, K.Lejaeghere et al. Reproducibility in density functional theory calculations of solids. Science, 351, aad3000(2016).
[16] J. W.Bennett, K. F.Garrity, K. M.Rabe, D.Vanderbilt. Pseudopotentials for high-throughput DFT calculations. Comput. Mater. Sci., 81, 446-452(2014).
[17] M.Topsakal, R. M.Wentzcovitch. Accurate projected augmented wave (PAW) datasets for rare-earth elements (RE = La–Lu). Comput. Mater. Sci., 95, 263-270(2014).
[18] D.Alfè, C.Cazorla, M. J.Gillan, S.Taioli.
[19] D. G.Pettifor. Theory of energy bands and related properties of 4d transition metals. I. Band parameters and their volume dependence. J. Phys. F: Met. Phys., 7, 613(1977).
[20] J. A.Moriarty. Ultrahigh-pressure structural phase transitions in Cr, Mo, and W. Phys. Rev. B, 45, 2004(1992).
[21] G. B.Grad et al. Electronic structure and chemical bonding effects upon the bcc to Ω phase transition:
[22] J.Furthmüller, G.Kresse, M.Marsman.
[23] A.Landa, P.Soderlind, L. H.Yang.
[24] S.Duan, H.Liu, H.Song, S.Wang, T.Zhang. Melting curve of vanadium up to 470 GPa simulated by
[25] L.Burakovsky, H.Cynn, D.Errandonea, S. G.MacLeod, M.Mezouar, J. E.Proctor, D.Santamaria-Perez. Melting curve and phase diagram of vanadium under high-pressure and high-temperature conditions. Phys. Rev. B, 100, 094111(2019).
[26] T.Ao, K. R.Cochrane, S. D.Crockett, P.Kalita, S.Root, P. F.Weck. Shock compression of vanadium at extremes: Theory and experiment. Phys. Rev. B, 102, 184109(2020).
[27] Z.Gao, H. Y.Geng, E.Greenberg, J.Li, J.-F.Lin, V. B.Prakapenka, N. P.Salke, T.Sekine, Y.Tan, Q.Wang, Y.Zhang. Melting curve of vanadium up to 256 GPa: Consistency between experiments and theory. Phys. Rev. B, 102, 214104(2020).
[28] J.Hafner, G.Kresse.
[29] J.Furthmüller, G.Kresse. Efficiency of
[30] J.Furthmüller, G.Kresse. Efficient iterative schemes for
[31] D. D.Koelling, A. H.MacDonald, W. E.Picket. A linearised relativistic augmented-plane-wave method utilising approximate pure spin basis functions. J. Phys. C: Solid State Phys., 13, 2675(1980).
[32] A. J.Freeman, H.Krakauer, M.Weinert, E.Wimmer. Full-potential self-consistent linearized-augmented-plane-wave method for calculating the electronic structure of molecules and surfaces: O2 molecule. Phys. Rev. B, 24, 864(1981).
[33] P.Blaha, D.Kvasnicka, J.Luitz, G. K. H.Madsen, K.Schwarz. An Augmented Plane Wave Plus Local Orbitals Program for Calculating Crystal Properties(2001).
[34] K.Schwarz. DFT calculations of solids with LAPW and WIEN2k. J. Solid State Chem., 176, 319(2003).
[35] D. M.Ceperley. Ground state of the fermion one-component plasma: A Monte Carlo study in two and three dimensions. Phys. Rev. B, 18, 3126(1978).
[36] B. J.Alder, D. M.Ceperley. Ground state of the electron gas by a stochastic method. Phys. Rev. Lett., 45, 566(1980).
[37] O.Gunnarsson, R. O.Jones. The density functional formalism, its applications and prospects. Rev. Mod. Phys., 61, 689(1989).
[38] K.Burke, M.Ernzerhof, J. P.Perdew. Generalized gradient approximation made simple. 1396, 78, 3865(1997).
[39] J. P.Perdew, Y.Wang. Accurate and simple density functional for the electronic exchange energy: Generalized gradient approximation. 3399, 40, 8800(R)(1989).
[40] A. D.Becke. Density-functional exchange-energy approximation with correct asymptotic behavior. Phys. Rev. A, 38, 3098(1988).
[41] J. P.Perdew, Y.Wang. Pair-distribution function and its coupling-constant average for the spin-polarized electron gas. Phys. Rev. B, 56, 7018(1997).
[42] N. D.Mermin. Thermal properties of the inhomogeneous electron gas. Phys. Rev. A, 137, A1441(1965).
[43] R.Ahuja, Y.Ding, J.Shu et al. Structural phase transition of vanadium at 69 GPa. Phys. Rev. Lett., 98, 085502(2007).
[44] J. E.Klepeis, A.Landa, B.Lee, R. E.Rudd, P.S?derlind. Theoretical confirmation of a high-pressure rhombohedral phase in vanadium metal. Phys. Rev. B, 75, 180101(R)(2007).
[45] X. R.Chen, H. Y.Geng, Y. X.Wang, Q.Wu. Stability of rhombohedral phases in vanadium at high-pressure and high-temperature: First-principles investigations. Sci. Rep., 6, 32419(2016).
[46] A.Belonoshko, B.Johansson, A.Rosengren, N.Skorodumova. Melting and critical superheating. Phys. Rev. B, 73, 012201(2006).
[47] A. B.Belonoshko, L.Burakovsky, S. P.Chen, B.Johansson, A. S.Mikhaylushkin, D. L.Preston, S. I.Simak, D. C.Swift. Molybdenum at high pressure and temperature: Melting from another solid phase. Phys. Rev. Lett., 100, 135701(2008).
[48] J.Klepeis, A.Landa, I.Naumov, A.Ruban, P.S?derlind, O.Velikokhatnyi, L.Vitos.
[49] C.Kittel. Introduction to Solid State Physics, 648(1986).
[50] C.Dai, X.Li, Y.Li, H.Tan, Y.Tan, Q.Wu, Y.Yu. Phase transition and strength of vanadium under shock compression up to 88 GPa. Appl. Phys. Lett., 105, 201910(2014).
[51] M. D.Alcala, V.López-Flores, A.Ortega, C.Real, M. A.Roldan. Mechanochemical synthesis of vanadium nitride. J. Eur. Ceram. Soc., 30, 2099(2010).
[52] M. H.Manghnani, K.Takemura, H.Manghnani M., J.Nellis W., M. and, W. J.Nellis, H.Manghnani M., J.Nellis W., M. and, M. F.Nicol, 443-444(1999).
[53] H.Cynn, A.Landa, P.S?derlind, D. A.Young. Zero-Kelvin compression isotherms of the elements 1 ≤
[54] P. H.Berens, D. H. J.Mackay, G. M.White, K. R.Wilson. Thermodynamics and quantum corrections from molecular dynamics for liquid water. J. Chem. Phys., 79, 2375(1983).
[55] J. W.Zwanziger. Computation of NMR observables: Consequences of projector-augmented wave sphere overlap. Solid State Nucl. Magn. Reson., 80, 14-18(2016).


Set citation alerts for the article
Please enter your email address

© Copyright 2018-2021 | Chinese Laser Press. All Rights Reserved 沪ICP备15018463号-20