
Tianhang Yang, Xiuqing Hu, Hanlie Xu, Chunqiang Wu, Chengli Qi, Mingjian Gu. Radiation Calibration Accuracy Assessment of FY-3D Hyperspectral Infrared Atmospheric Sounder Based on Inter-Comparison[J]. Acta Optica Sinica, 2019, 39(11): 1130003
- Acta Optica Sinica
- Vol. 39, Issue 11, 1130003 (2019)
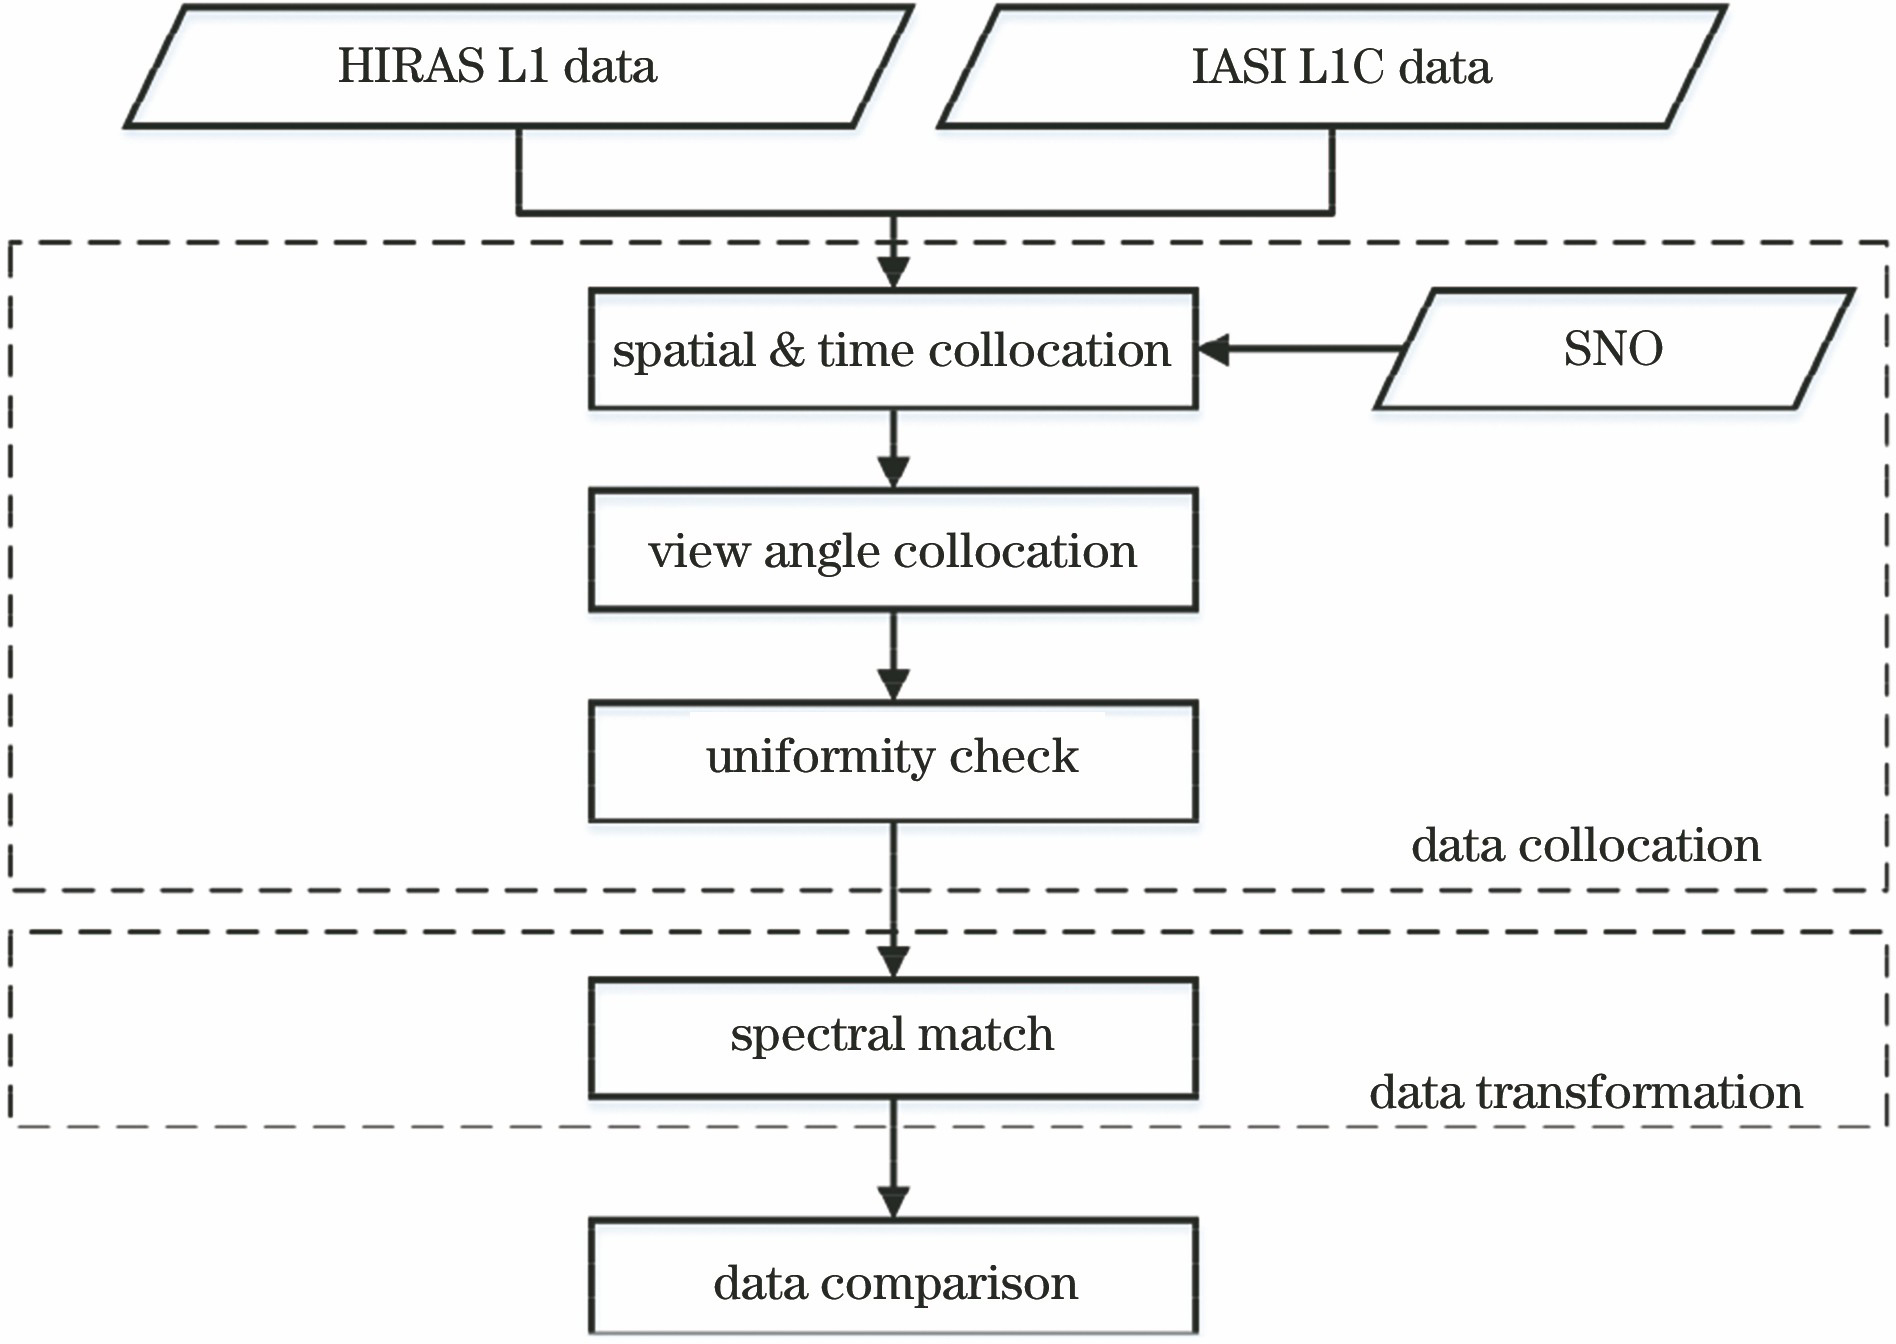
Fig. 1. Inter-comparison processes of HIRAS and IASI
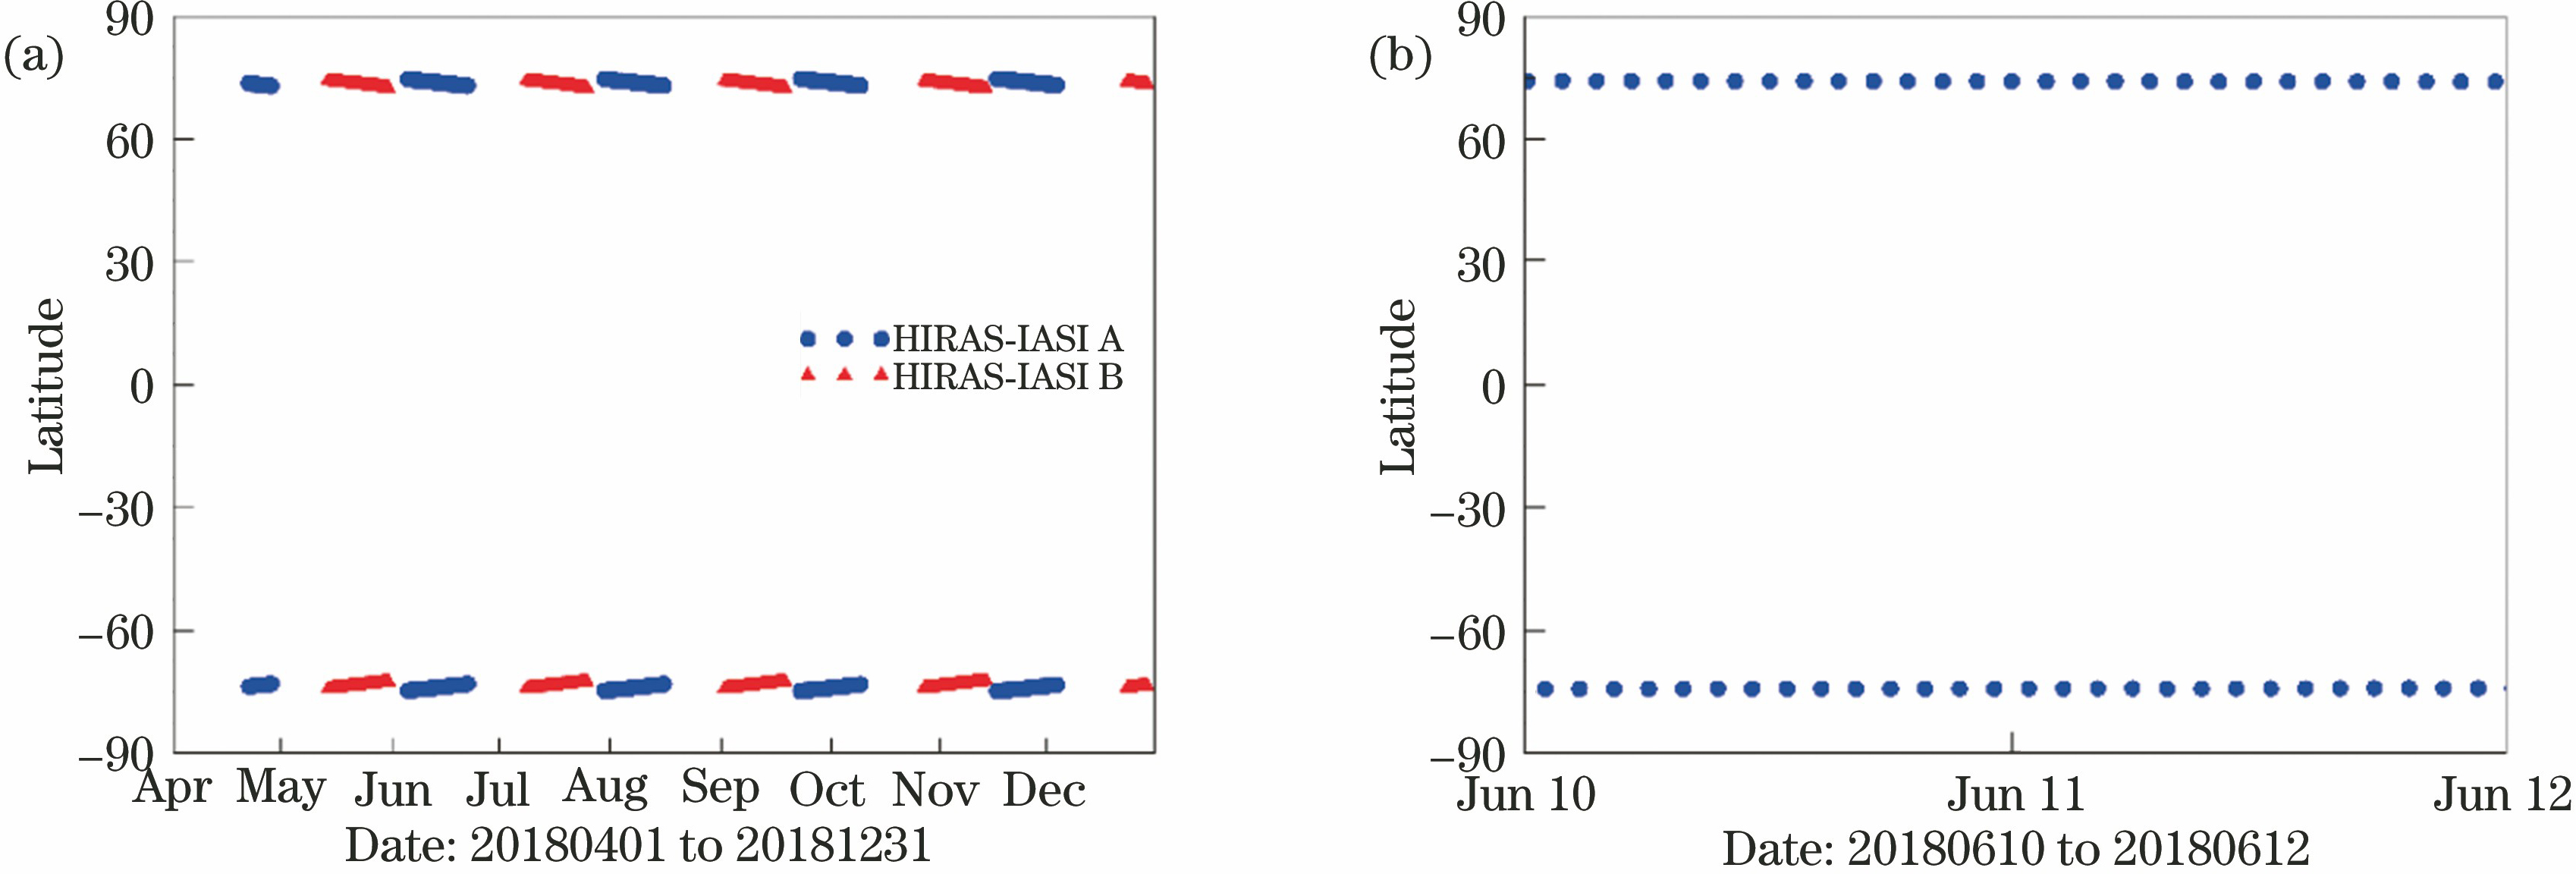
Fig. 2. Long-term latitude distributions of SNO events of HIRAS-IASI/A and HIRAS-IASI/B. (a) Latitude distribution of SNO events of HIRAS-IASI/A and HIRAS-IASI/B from April to December, 2018; (b) latitude distribution of SNO events of HIRAS-IASI/A during 10-12 June, 2018
Fig. 3. Pixel overlap rate of HIRAS-IASI versus pixel distance between HIRAS and IASI (nadir)
Fig. 4. Pixel matching of MERSI-II and HIRAS-IASI
Fig. 5. BT difference at 900 cm-1 between HIRAS and IASI/A versus ratio of standard deviation to mean of MERSI-II in channel 24 (ratio is below 0.01). The mean of HIRAS-IASI/A BT difference is 0.106 K and the standard deviation of BT difference is 0.485 K
Fig. 6. Matching of HIRAS-IASI spectra. (a) HIRAS (solid line) and IASI (dash line) spectra simulated by LBLRTM for standard atmospheric profile; (b) BT difference between IASIH and HIRAS
Fig. 7. Spatial distributions of matching samples of HIRAS-IASI/A and HIRAS-IASI/B
Fig. 8. Spectral distribution, mean deviation of BT, and standard deviation of BT difference for HIRAS-IASI/A and HIRAS-IASI/B(North and South Arctic regions). (a) HIRAS spectral distributions for HIRAS-IASI/A and HIRAS-IASI/B, the solid line represents the mean of BT(dark); (b) BT mean deviation of HIRAS-IASI/A and HIRAS-IASI/B; (c) standard deviation of BT differences of HIRAS-IASI/A and HIRAS-IASI/B
Fig. 9. Mean deviation of BT for HIRAS-IASI/A and HIRAS-IASI/B versus mean of HIRAS BT. (a)(b) LWIR; (c)(d) MWIR; (e)(f) SWIR
Fig. 10. Scatter plots of HIRAS-IASI/A BT differences versus HIRAS BT. (a) 678.125 cm-1; (b) 900.0 cm-1; (c) 1500.0 cm-1; (b) 2157.5 cm-1
Fig. 11. Scatter plots of HIRAS-IASI/B BT differences versus HIRAS BT. (a) 678.125 cm-1; (b) 900.0 cm-1; (c) 1500.0 cm-1; (b) 2157.5 cm-1
Fig. 12. Long-term sequences of BT differences of HIRAS-IASI/A in LWIR. (a) 750.00 cm-1; (b) 800.00 cm-1; (c) 950.00 cm-1
Fig. 13. Long-term sequences of BT differences of HIRAS-IASI/A in MWIR. (a) 1300.00 cm-1; (b) 1500.00 cm-1; (c) 1700.00 cm-1
Fig. 14. Long-term sequences of BT differences of HIRAS-IASI/A in SWIR. (a) 2200.00 cm-1; (b) 2400.00 cm-1; (c) 2500.00 cm-1
|
Table 1. Instrument parameter characteristics of HIRAS and IASI
|
Table 2. Matching criteria for SNOs of HIRAS-IASI

Set citation alerts for the article
Please enter your email address
© Copyright 2018-2021 | Chinese Laser Press. All Rights Reserved 沪ICP备15018463号-20