
Xiaosa Zhao, Xijiang Chen, Ya Ban, Dandan Zhang, Lexian Xu. Power Function-Weighted Image Stitching Method Involving Improved SURF and Cell Acceleration[J]. Laser & Optoelectronics Progress, 2020, 57(24): 241018
- Laser & Optoelectronics Progress
- Vol. 57, Issue 24, 241018 (2020)
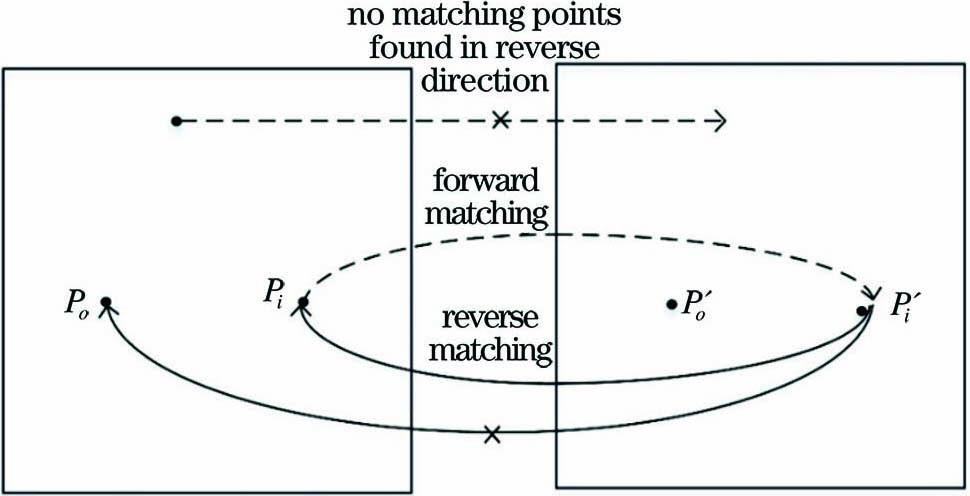
Fig. 1. Matching process of bidirectional consistency constraint
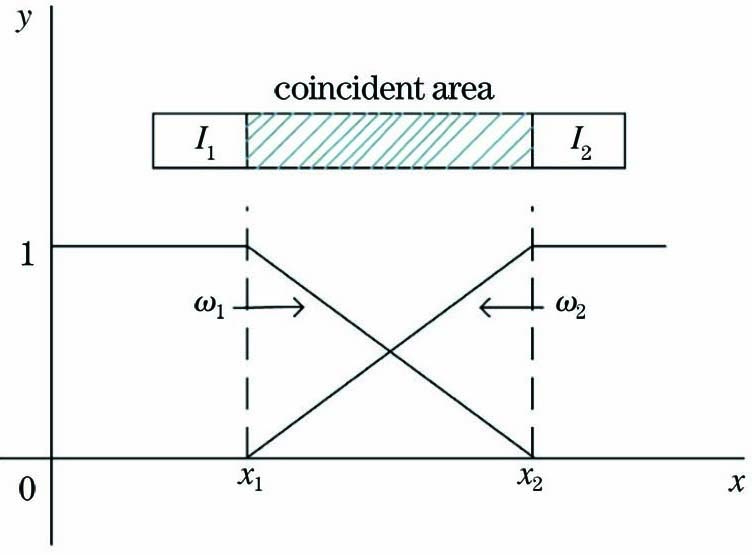
Fig. 2. Fusion process of slow in and out weighted fusion algorithm
Fig. 3. h(t) function curves under different conditions
Fig. 4. Power function weighted fusion process
Fig. 5. Power function weighting coefficient of Cell acceleration
Fig. 6. Matching results of image feature points under different luminance by different algorithms. (a) Traditional SURF algorithm; (b) proposed algorithm
Fig. 7. Matching results of image feature points under different angles by different algorithms. (a) Traditional SURF algorithm; (b) proposed algorithm
Fig. 8. Matching results of image feature points under different resolutions by different algorithms. (a) Traditional SURF algorithm; (b) proposed algorithm
Fig. 9. Matching results of image feature points under different scales by different algorithms. (a) Traditional SURF algorithm; (b) proposed algorithm
Fig. 10. Two original image sequences with different brightness. (a) Image 1; (b) image 2
Fig. 11. Comparison of results of three fusion algorithms on images for different brightness. (a) Slow in and slow out weighted fusion algorithm; (b) Ref. [16]; (c) proposed algorithm
Fig. 12. Two original image sequences with different angles. (a) Image 1; (b) image 2
Fig. 13. Comparison of results of three fusion algorithms on images from different angles. (a) Slow in and slow out weighted fusion algorithm; (b) Ref. [16]; (c) proposed algorithm
Fig. 14. Two original image sequences. (a)Image 1 (b)Image 2
Fig. 15. Comparison of results of three fusion algorithms on images with different resolutions. (a) Gradual fade weighted fusion algorithm; (b) Ref. [16]; (c) proposed algorithm
Fig. 16. Two original image sequences of different heights. (a) Image 1; (b) image 2
Fig. 17. Comparison of results of three fusion algorithms on images of different heights. (a) Slow in and slow out weighted fusion algorithm; (b) Ref. [16]; (c) proposed algorithm
Fig. 18. Time-consuming comparison histogram of 4 groups of experiments
Fig. 19. MSE comparison of related algorithms
Fig. 20. Information entropy data comparison
|
Table 1. Test results of K values
| |||||||||||||||||||||||||||||||||||
Table 2. Data comparison of related algorithms

Set citation alerts for the article
Please enter your email address
© Copyright 2018-2021 | Chinese Laser Press. All Rights Reserved 沪ICP备15018463号-20