
Debarghya Sarkar, Paul H. Dannenberg, Nicola Martino, Kwon-Hyeon Kim, Yue Wu, Seok-Hyun Yun. Precise photoelectrochemical tuning of semiconductor microdisk lasers[J]. Advanced Photonics, 2023, 5(5): 056004
- Advanced Photonics
- Vol. 5, Issue 5, 056004 (2023)
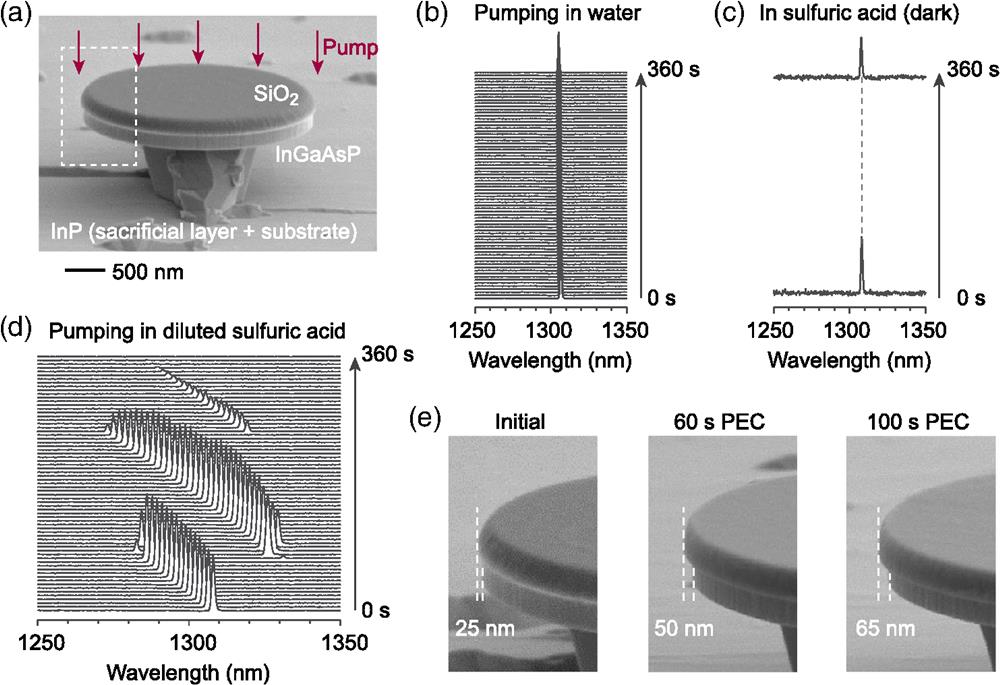
Fig. 1. (a) SEM image of a microdisk-on-pillar structure. Dotted white box indicates region of zoom-in SEM images in (e). Temporal variation of microdisk laser spectrum showing (b) no peak shift with continuous pump laser illumination in water, (c) no peak shift in sulfuric acid under no illumination, and (d) blueshift and mode change of laser peak with continuous illumination in sulfuric acid. (e) SEM images of microdisks before (initial), after 60 s and after 100 s of PEC etching.
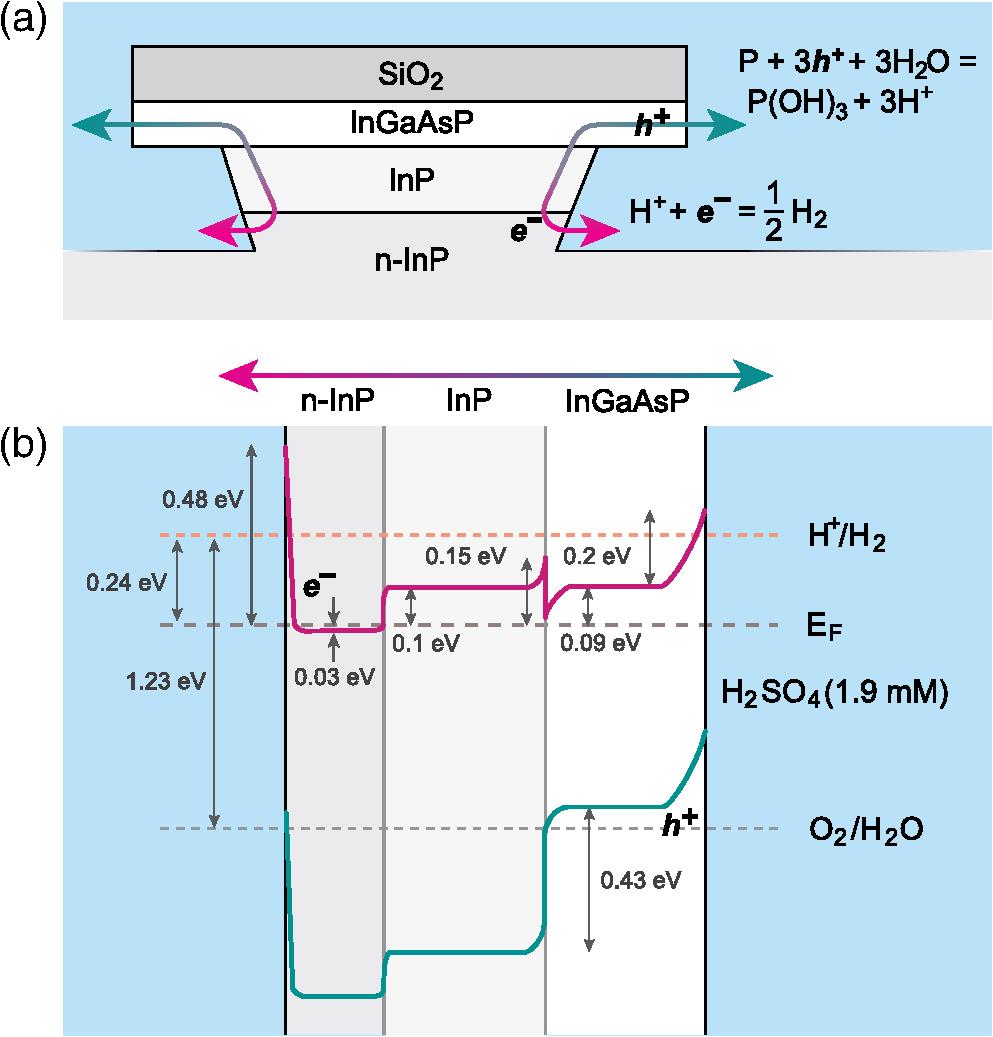
Fig. 2. (a) Schematic diagram of a microdisk-on-substrate structure and the flow of electrons and holes enabling redox PEC reactions. (b) Band diagram depicting the energy levels along the charge carrier path between InGaAsP through InP pedestal and
Fig. 3. (a) Theoretical steady-state carrier density as a function of excitation laser intensity based on Eq. (2). (b) Experimental data showing the rate of wavelength changes. (c) Best fit curve based on Eq. (4).
Fig. 4. SEM images of a bilayer InGaAsP-in-InP pillar structure after immersion in dilute sulfuric acid under different illumination conditions. (a) Without illumination, (b) under illumination with wavelengths >
Fig. 5. (a) SEM images of silica-capped microdisks with PEC etching for 30, 60, and 100 s, with the silica cap removed to show the top and side morphology. Also shown is the bottom surface of a post-PEC microdisk released from its pillar. (b) SEM images of uncapped microdisks after 30 and 60 s of PEC etching, revealing severe top surface roughening. (c), (d) Temporal evolution of lasing peak intensity (mean and standard deviation of five disks) under PEC etch for (c) silica-capped and (d) uncapped microdisks.
Fig. 6. Wavelength tuning by PEC etching. Lasing wavelength histogram of an array of 36 disk-on-pillar samples (i) as fabricated by UV lithography and RIE, and the same array tuned sequentially to give narrowband wavelength distributions of (ii)
Fig. 7. Isolated microdisk LPs. (a) Optical micrograph showing LPs on a PDMS substrate. (b) Histogram of lasing wavelength of LPs in two different batches after on-chip PEC tuning.
Fig. 8. (a) Optical micrograph showing cells with incorporated LPs. One LP (LP1) is internalized by a cell at

Set citation alerts for the article
Please enter your email address
© Copyright 2018-2021 | Chinese Laser Press. All Rights Reserved 沪ICP备15018463号-20