
Gongpei Pan, Xuefeng Du, Jun Zhao. Experimental study on extinction characteristics of aqueous foam(Invited)[J]. Infrared and Laser Engineering, 2020, 49(7): 20201023
- Infrared and Laser Engineering
- Vol. 49, Issue 7, 20201023 (2020)
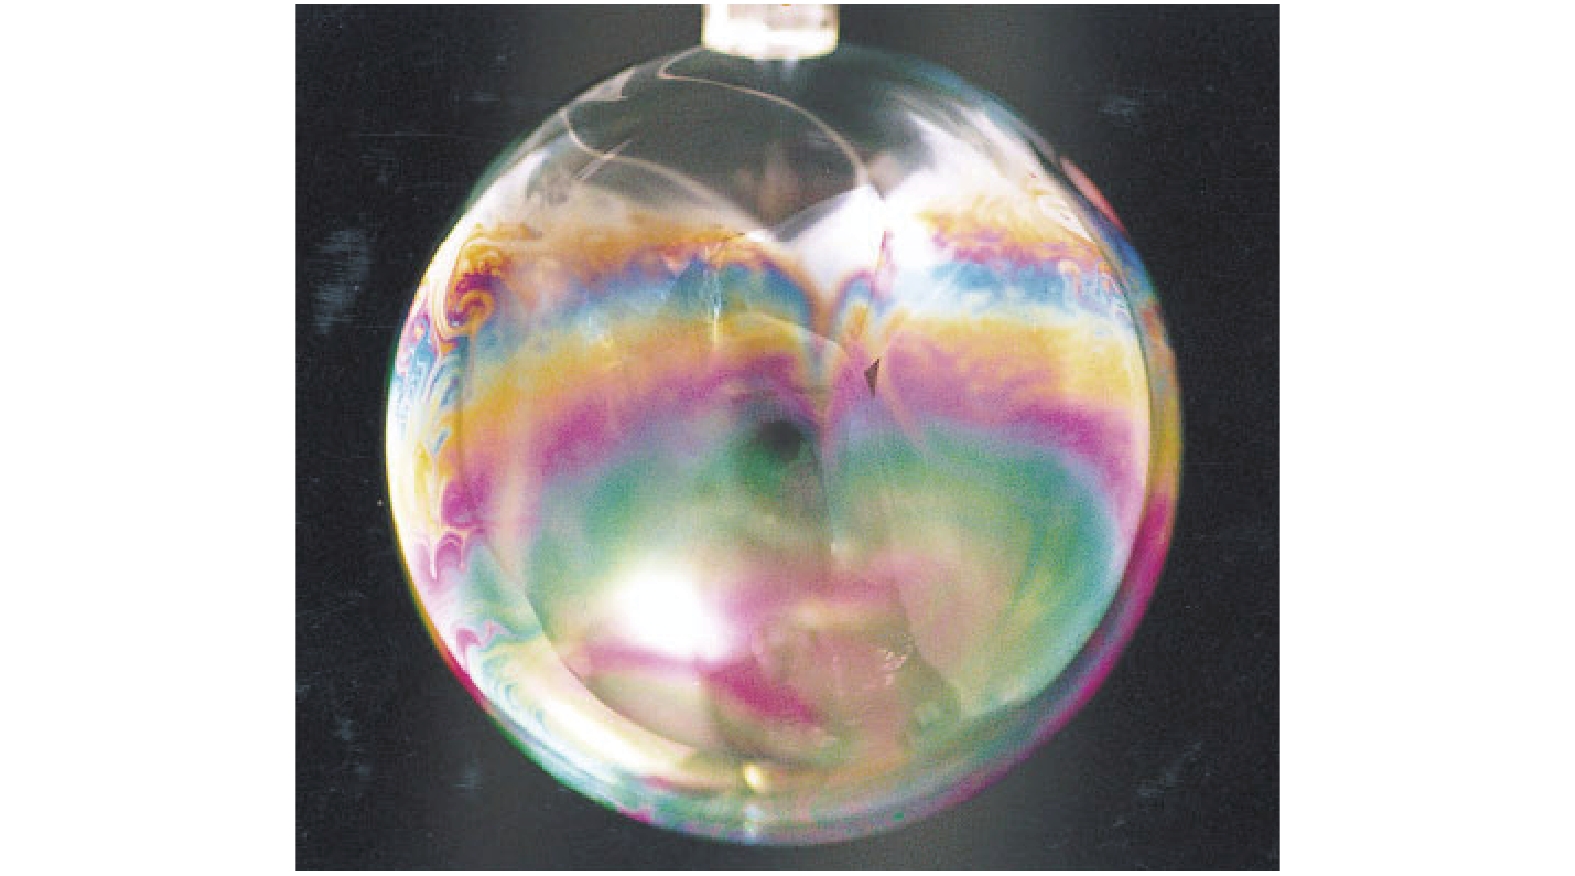
Fig. 1. Independent air bubble
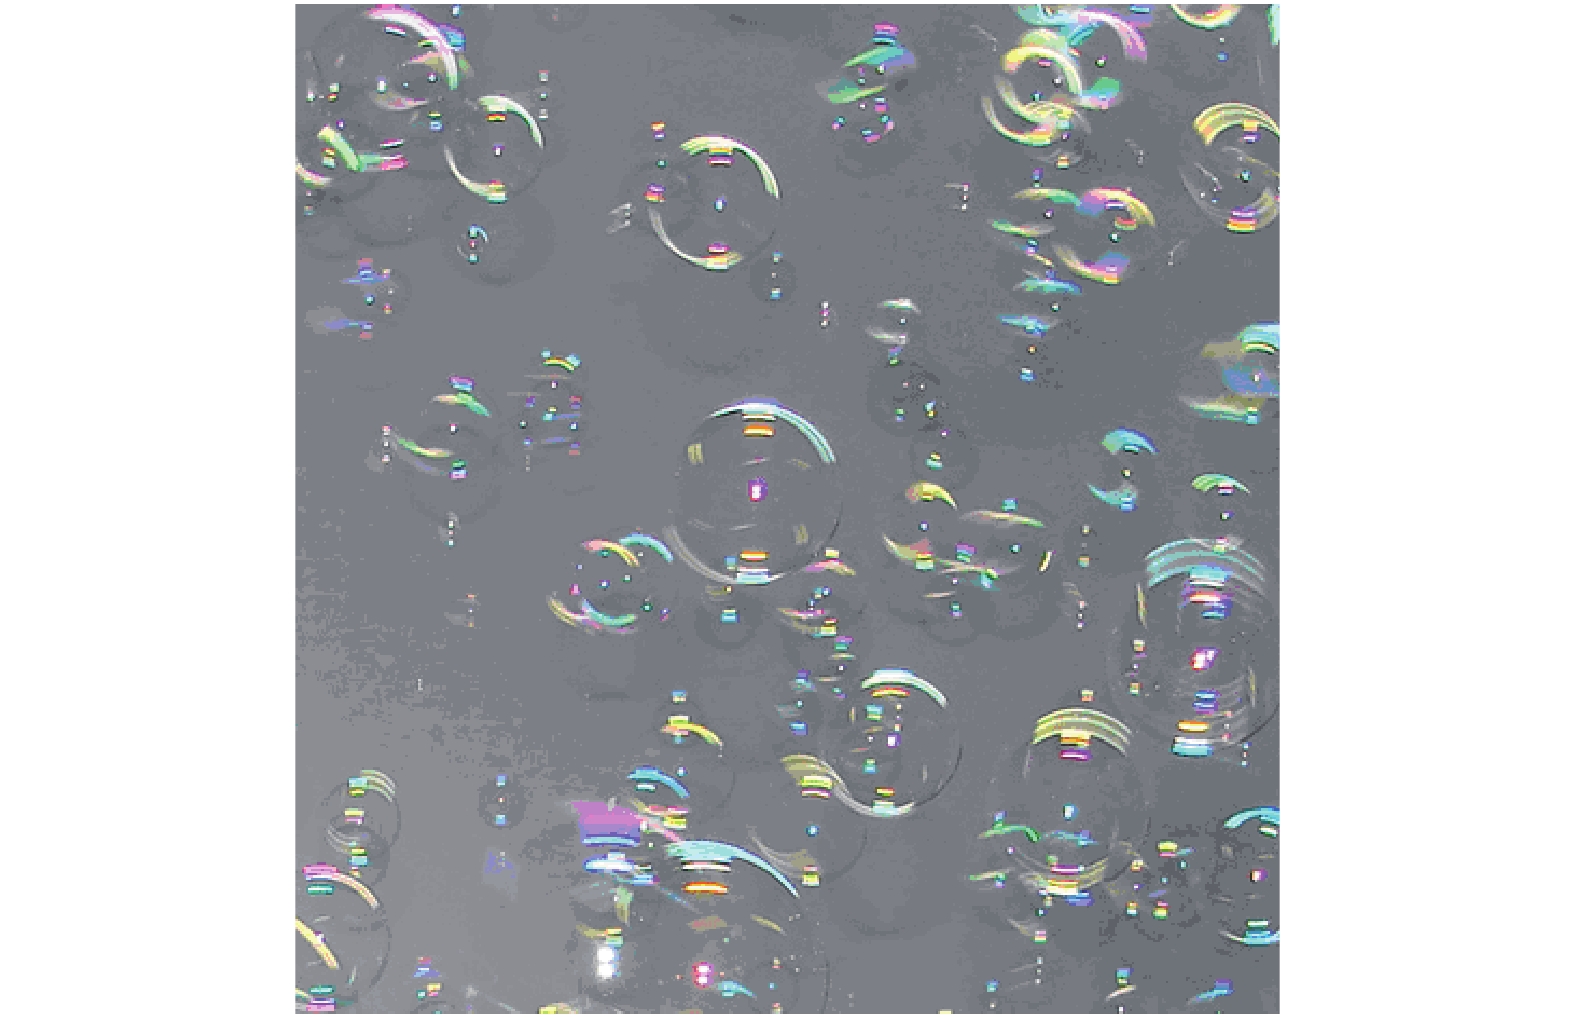
Fig. 2. Discrete foam group
Fig. 3. Conglutinated foam aggregate
Fig. 4. Foams cloud
Fig. 5. Aqueous foam for measurement and foam cylinder for sampling
Fig. 6. Principle of measurement
Fig. 7. Schematic of OPAG33 testing
Fig. 8. Scene of infrared extinction test of foams cloud
Fig. 9. Relation between infrared transmittance and time at different wavelengths
Fig. 10. Foam infrared extinction coefficient vs wavelength diagram
Fig. 11. Masking effect with SAT-HY6800 focal plane thermal image
Fig. 12. Extinction performance test system for laser(1.06, 10.6 μm)
Fig. 13. Attenuation curves of different thickness foam with different bubble size distributions of 4−7 mm to 1.06 μm laser
Fig. 14. Attenuation curves of different thickness foam with bubble size distributions of 4−7 mm to 10.6 μm laser
Fig. 15. Testing system for attenuation characteristics of foam to mm wave
Fig. 16. Attenuation effect with thickness of 20 cm to 8 mm wave
Fig. 17. Attenuation effect with thickness of 80 cm to 8 mm wave(foam bubble size distribution of 2-3.5 cm)
Fig. 18. Attenuation effect with thickness of 80 cm to 8 mm wave(foam bubble size distribution of 0.8-2 cm)
Fig. 19. Schematic diagram of measurement system for centimeter-wave attenuation characteristics
Fig. 20. Attenuation effect with thickness of 20 cm to 2, 3 cm centimeter-wave
Fig. 21. Attenuation effect with thickness of 60 cm to 2, 3 cm centimeter-wave
Fig. 22. Attenuation effect with thickness of 80 cm to 2, 3 cm centimeter-wave
Fig. 23. Four types of foam interface
| |||||||||||||||||||||||
Table 1. Transmittance of different thickness of foams
|
Table 2. Infrared extinction coefficient of foam on un-cooling focal plane thermal image with SAT-HY6800
|
Table 3. Average transmittance of laser with different thickness of foam bubble size distribution of 4−7 mm
|
Table 4. Average transmittance of laser with thickness of 10 cm different foam bubble size distributions(1.06 μm,10.6 μm)
|
Table 5. Test results of 3 mm millimeter-wave with thickness of 20 cm foams
|
Table 6. Test results of 2, 3 cm centimeter-wave with different thickness foams

Set citation alerts for the article
Please enter your email address
© Copyright 2018-2021 | Chinese Laser Press. All Rights Reserved 沪ICP备15018463号-20