• Photonics Research
  • Vol. 9, Issue 6, 937 (2021)
Kaiyu Cui1、2、†,*, Zhilei Huang1、†, Ning Wu1、2, Qiancheng Xu1、2, Fei Pan1、2, Jian Xiong1、2, Xue Feng1、2, Fang Liu1、2, Wei Zhang1、2、3, and Yidong Huang1、2、3
Author Affiliations
  • 1Department of Electronic Engineering, Tsinghua University, Beijing 100084, China
  • 2Beijing National Research Center for Information Science and Technology (BNRist), Tsinghua University, Beijing 100084, China
  • 3Beijing Academy of Quantum Information Science, Beijing, China
  • show less
    DOI: 10.1364/PRJ.403833 Cite this Article Set citation alerts
    Kaiyu Cui, Zhilei Huang, Ning Wu, Qiancheng Xu, Fei Pan, Jian Xiong, Xue Feng, Fang Liu, Wei Zhang, Yidong Huang. Phonon lasing in a hetero optomechanical crystal cavity[J]. Photonics Research, 2021, 9(6): 937 Copy Citation Text show less
    (a) Top-view schematic of the hetero optomechanical crystal (OMC) cavity. Inset shows an oblique view of the unit cell that forms the periodic structure. The unit cell can be determined by four geometric parameters, namely, the height (h), width (w), radius of the air hole (r), and length (d), which correspond to the pitch of the periodic structure. (b) Mode profile of the electric y-component of the optical mode and (c) that of the displacement of the mechanical mode. (d), (e) TE optical bands and y- and z-symmetric mechanical bands of the P-I (green) and P-II (yellow) structures, respectively. The red dashed lines in (d) and (e) represent the frequency of the optical and mechanical modes, respectively. Owing to the unequal period of the P-I and P-II structures, the X points correspond to different wavevectors, and the light lines of the P-I (yellow dashed line) and P-II (green dashed line) structures do not overlap in the photonic band diagram.
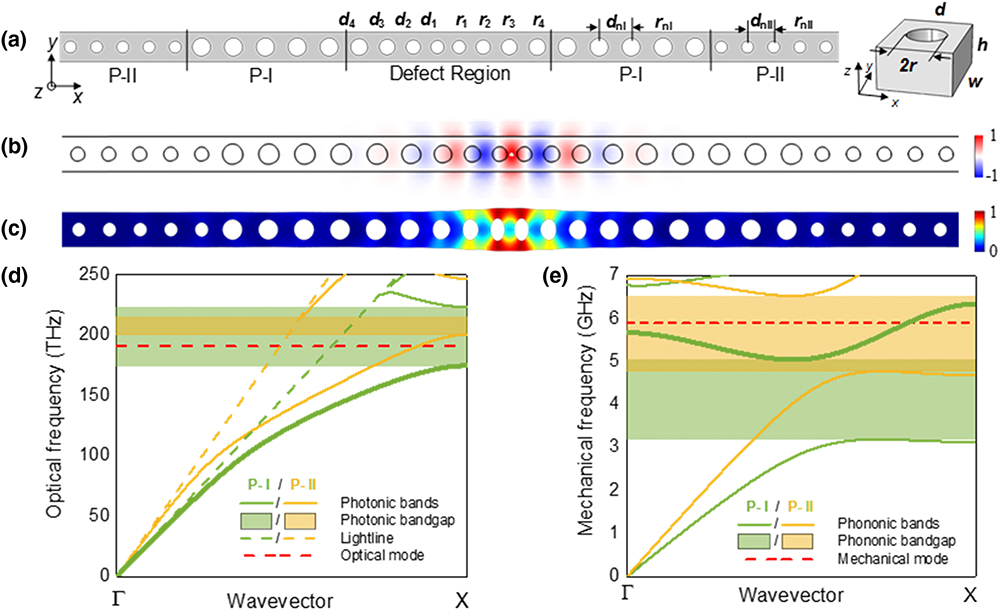
    Fig. 1. (a) Top-view schematic of the hetero optomechanical crystal (OMC) cavity. Inset shows an oblique view of the unit cell that forms the periodic structure. The unit cell can be determined by four geometric parameters, namely, the height (h), width (w), radius of the air hole (r), and length (d), which correspond to the pitch of the periodic structure. (b) Mode profile of the electric y-component of the optical mode and (c) that of the displacement of the mechanical mode. (d), (e) TE optical bands and y- and z-symmetric mechanical bands of the P-I (green) and P-II (yellow) structures, respectively. The red dashed lines in (d) and (e) represent the frequency of the optical and mechanical modes, respectively. Owing to the unequal period of the P-I and P-II structures, the X points correspond to different wavevectors, and the light lines of the P-I (yellow dashed line) and P-II (green dashed line) structures do not overlap in the photonic band diagram.
    Top-view scanning electron microscopy (SEM) images of the (a) hetero OMC cavity, (b) OMC cavity without a hetero structure, and (c) OMC cavity with radiation shield. (d) Optical and (e) mechanical spectra of the three types of OMC cavities.
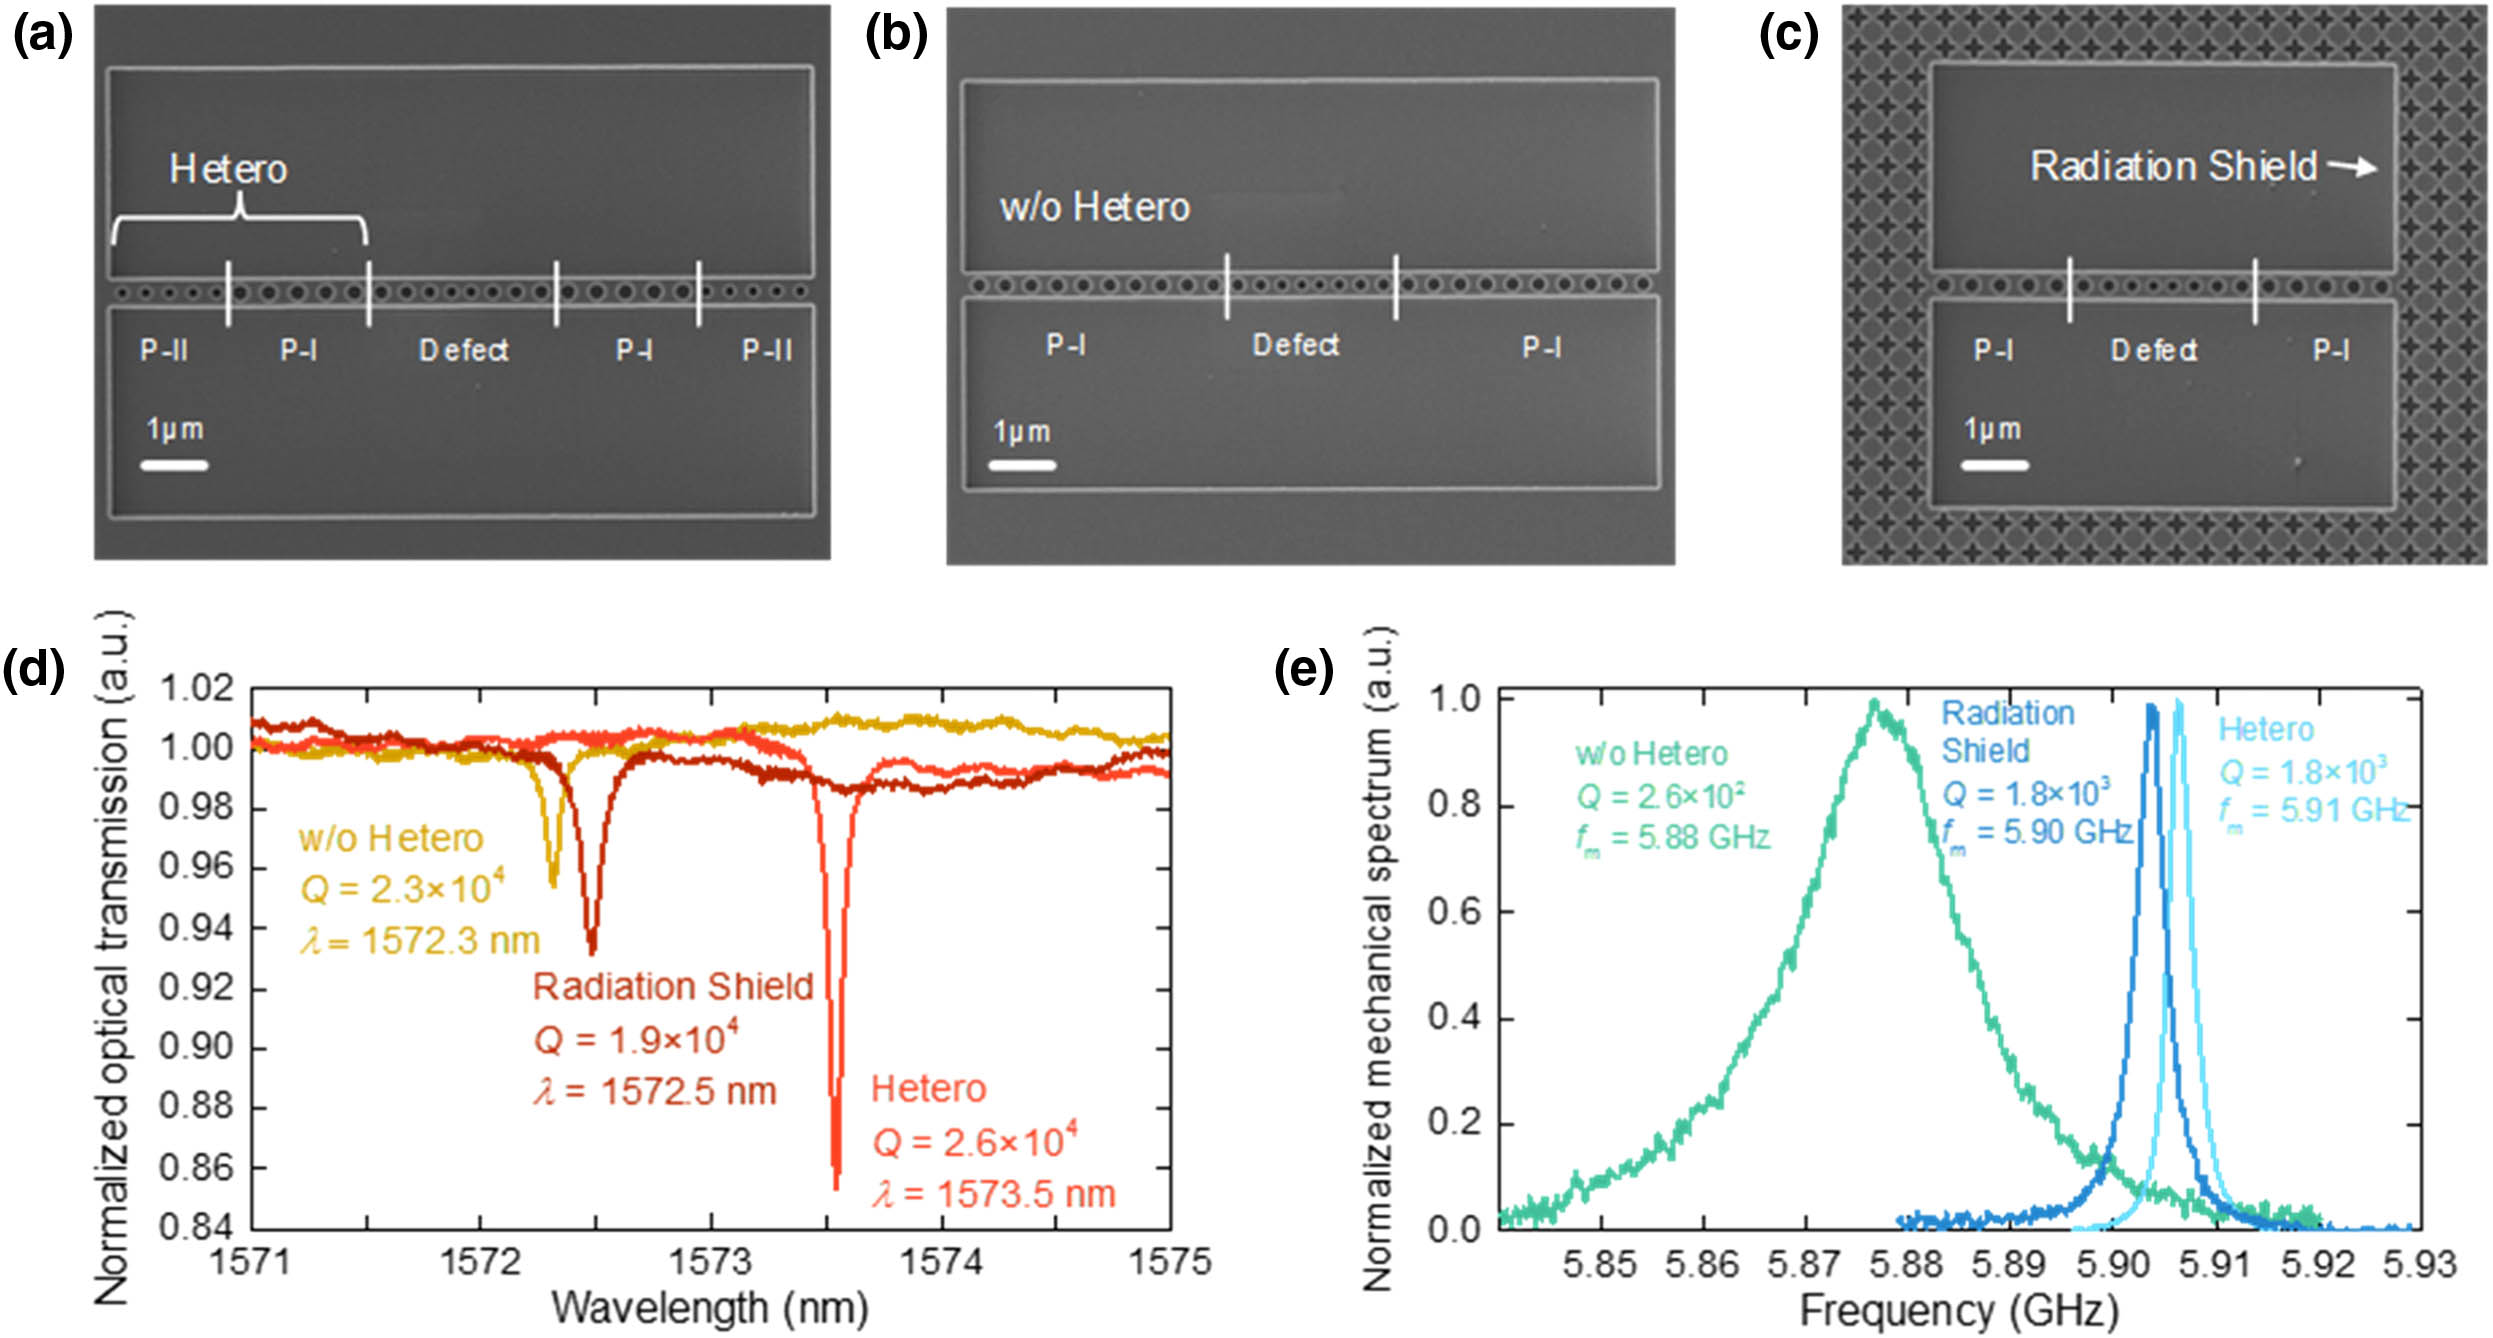
    Fig. 2. Top-view scanning electron microscopy (SEM) images of the (a) hetero OMC cavity, (b) OMC cavity without a hetero structure, and (c) OMC cavity with radiation shield. (d) Optical and (e) mechanical spectra of the three types of OMC cavities.
    (a) SEM image of the measured hetero OMC cavity. (b) Normalized phonon number and linewidth of the hetero OMC cavity as a function of coupled optical power. (c) Normalized mechanical spectra of the hetero OMC cavity before and after phonon lasing. (d) Normalized optical transmission for low- and high-pump power levels with pump power of 0.16 μW and 58.1 μW as a function of the pump wavelength and the detuning wavelength. The two crosses joined by the purple dashed line indicate the same detuning. Herein, the ratio between the optical detuning and optical decay rate was 0.50 when the linewidth of the mechanical spectrum achieved a minimum. (e) Measured mechanical frequency with pump power of 58.1 μW as a function of the pump wavelength. Inset shows the shift in mechanical peak under lasing at different pump wavelengths.
    Fig. 3. (a) SEM image of the measured hetero OMC cavity. (b) Normalized phonon number and linewidth of the hetero OMC cavity as a function of coupled optical power. (c) Normalized mechanical spectra of the hetero OMC cavity before and after phonon lasing. (d) Normalized optical transmission for low- and high-pump power levels with pump power of 0.16 μW and 58.1 μW as a function of the pump wavelength and the detuning wavelength. The two crosses joined by the purple dashed line indicate the same detuning. Herein, the ratio between the optical detuning and optical decay rate was 0.50 when the linewidth of the mechanical spectrum achieved a minimum. (e) Measured mechanical frequency with pump power of 58.1 μW as a function of the pump wavelength. Inset shows the shift in mechanical peak under lasing at different pump wavelengths.
    Allan deviation of the fundamental mechanical mode after phonon lasing.
    Fig. 4. Allan deviation of the fundamental mechanical mode after phonon lasing.
    Kaiyu Cui, Zhilei Huang, Ning Wu, Qiancheng Xu, Fei Pan, Jian Xiong, Xue Feng, Fang Liu, Wei Zhang, Yidong Huang. Phonon lasing in a hetero optomechanical crystal cavity[J]. Photonics Research, 2021, 9(6): 937
    Download Citation