
Weiling Li, Yan Zhang. Dual-Frequency Angle-Independent High-Transmittance Metasurface[J]. Laser & Optoelectronics Progress, 2022, 59(3): 0316002
- Laser & Optoelectronics Progress
- Vol. 59, Issue 3, 0316002 (2022)
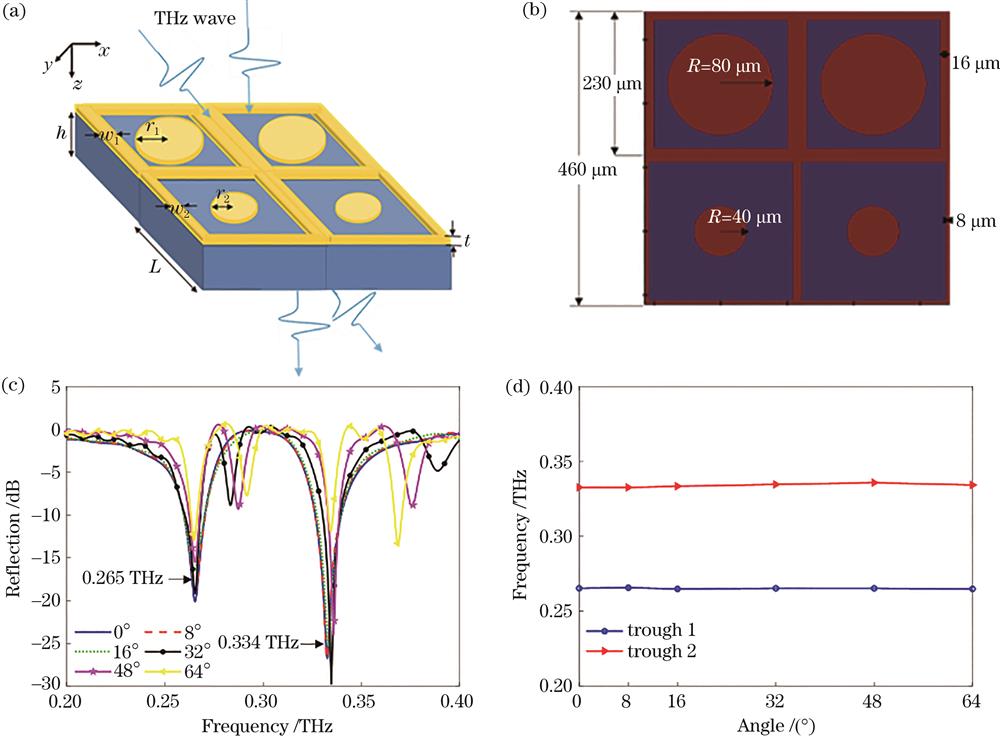
Fig. 1. Schematic of sample and its reflection spectra. (a) Three-dimensional view of sample; (b) two-dimensional structure diagram of sample; (c) reflectance spectrum calculated by simulation; (d) operating frequency curves at different incident angles
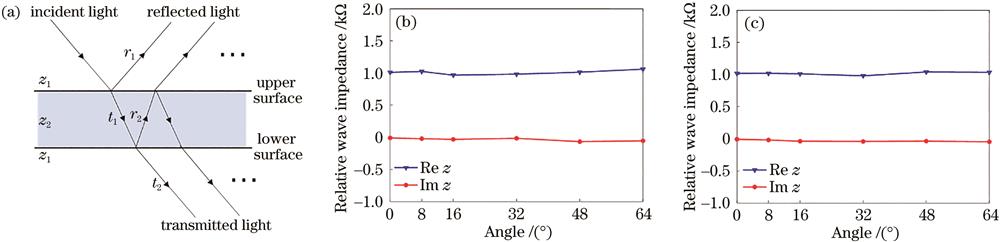
Fig. 2. Wave impedance calculation results. (a) Modeling diagram without ignoring multiple reflections; (b) wave impedance calculation result of sample at first working frequency of 0.265 THz; (c) wave impedance calculation result of sample at second working frequency of 0.334 THz
Fig. 3. Near-field electric field response of metasurfaces. (a)(b) Near-field electric field responses of structure of working frequency 1 and 2 under normal incidence of TE wave; (c) (d) near-field electric field at working frequency 1 and 2 when TE wave is incident at 48°
Fig. 4. Experimental results. (a) Sample image; (b) enlarged image; (c) diagram of experimental system; (d) experimental transmission spectra; (e) simulated transmission spectra

Set citation alerts for the article
Please enter your email address
© Copyright 2018-2021 | Chinese Laser Press. All Rights Reserved 沪ICP备15018463号-20