Abstract
Laser target components consist of multicomponent porous and nonporous materials that are adhesively bonded together. In order to assess the extent and quantity of adhesive wicking into porous foam, micro X-ray computed tomography (CT) and image processing software have been utilized. Two different laser target configurations have been assessed in situ and volume rendered images of the distribution and quantities of adhesive have been determined for each.1 Scope
High energy density plasma physics experiments are required to validate computer simulations in the absence of nuclear testing[1, 2]. These experiments are carried out worldwide, including the National Ignition Facility[3] and Orion Laser facility[4], and require complex targets made of challenging materials. The targets can consist of multicomponent/materials that require adhesives to bond components together. Adhesive wicking into foam material changes the physical properties of the foam. Wicking is the absorption of a liquid by capillary action; in this case the uncured adhesive into the pores of the foam material prior to adhesive curing. The degree of wicking needs to be assessed as the changes in the physical properties of the foam will ultimately increase the accuracy of computer simulations. The aim of this work is to establish if X-ray computed tomography (CT) is a viable nondestructive method for determining the extent of adhesive wicking into carbon foam. We have had to utilize a nondestructive method for this analysis as the assembly cannot be machined, the foam material would tear during the sectioning process.
2 Experimental
Two different types of laser target assemblies, produced at Atomic Weapons Establishment (AWE), were analysed using the Xradia™ micro-XCT 200 system. The optimizations of X-ray CT parameters used for this assessment are documented. X-ray CT data were image processed in the ScanIP software environment (Synopsys, Exeter, UK) to determine the quantity of adhesive and to produce volumetric rendered images.
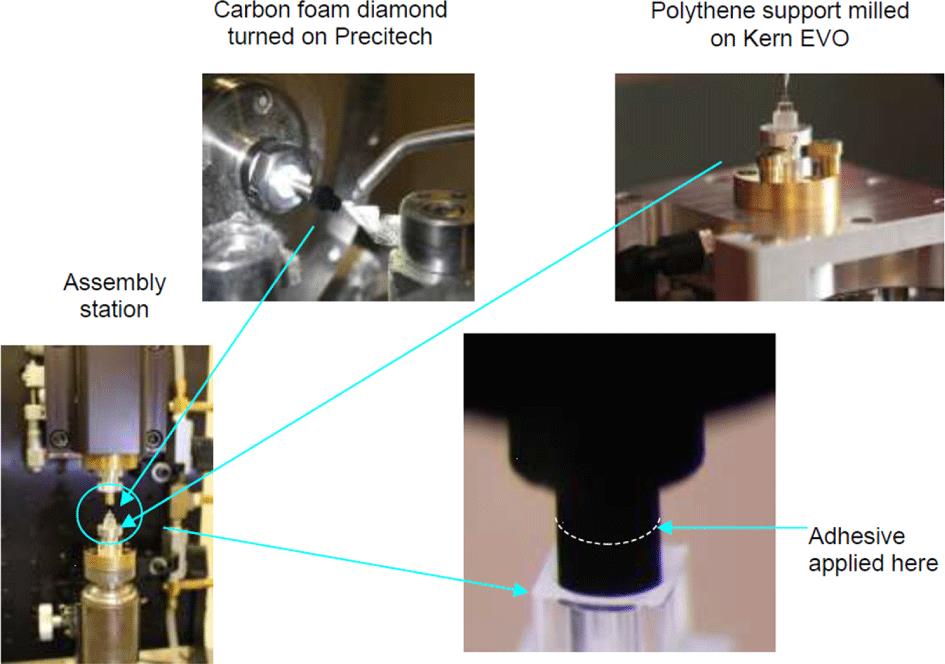
Each target consisted of three different materials: carbon foam, polythene holder and adhesive. The carbon foam was precision machined into a cylindrical form using precision diamond turning lathe (Precitech) and the polythene holder was milled using a Kern EVO. The target components were assembled together using the assembly station and the adhesive applied around the circumference of the carbon foam, as shown in Figure 1. The carbon foam was machined back on the lathe to be parallel to the top surface of the polythene support. The two types of target assemblies that were investigated differed in the geometry of the polythene support, as shown in the schematic of Figure 2. The polythene support was cylindrical for Sample A and cubic for Sample B.
Sign up for High Power Laser Science and Engineering TOC. Get the latest issue of High Power Laser Science and Engineering delivered right to you!Sign up now
The target assemblies were mounted onto the X-ray CT mount as shown in Figure 3.
All three materials have a similar X-ray opacity prompting the use of phase contrast geometry rather than the standard absorption mode. The X-ray CT system used for imaging was equipped with phase contrast and standard absorption mode capability. Phase contrast was achieved on the Xradia™ micro-XCT 200 system by increasing the sample to source and sample to detector distances (Tables 1 and 2). Phase contrast imaging records variation in the phase of the emerging X-rays and by increasing the distances above exaggerates the difference in the edges/interfaces of materials with similar X-ray opacities. This improves the contrast sensitivity especially when imaging low absorption materials[5].
The X-ray CT data was obtained using the Xradia™ Micro-XCT 200 CT system shown in Figure 4 and proprietary software (TXM Controller, TXM Reconstructor and 3D viewer). The X-ray CT parameters optimized for transmission through the two samples are detailed in Tables 1 and 2.
| Source settings | 40 kV 250 $\unicode[STIX]{x03BC}$A |
| Source sample separation distance | 126.26 mm |
| Detector to sample distance | 129.05 mm |
| Exposure time | 70 s |
| Number of projections | 1000 |
| Camera binning | 2 |
| Pixel size | 1.38 $\unicode[STIX]{x03BC}$m |
| Objective | X9.71 |
Table 1. X-ray acquisition parameters for Sample A.
| Source settings | 39 kV 250 $\unicode[STIX]{x03BC}$A |
| Source sample separation distance | 126.26 mm |
| Detector to sample distance | 129.56 mm |
| Exposure time | 70 s |
| Number of projections | 500 |
| Camera binning | 2 |
| Pixel size | 1.37 $\unicode[STIX]{x03BC}$m |
| Objective | X9.71 |
Table 2. X-ray acquisition parameters for Sample B.
Scan IP image processing software was then used to analyse the X-ray CT data. Voxels were created with attenuation and density data in all three dimensions (XYZ). The adhesive volumes were obtained by applying smoothing filters and thresholding the data. Volume-rendered images of the adhesive were produced showing the distribution of the adhesive within the carbon foam and polythene support.
3 Results and discussion
3.1 Sample A – cylindrical support
X-ray CT sections of Sample A are given in Figures 5 and 6. These sections reveal the structure of the cylindrical polythene support, adhesive and carbon foam materials. Each pixel conveys information relating to the X-ray attenuation and density of the scanned material; brighter pixels represent higher X-ray absorbing regions compared with darker lower absorbing ones. For example, the adhesive region has a number of air bubbles represented by dark circles within the bulk of the adhesive. The inner ring shows the degree of adhesive wicking into the carbon foam, was $20.0\pm 1.0~\unicode[STIX]{x03BC}\text{m}$, indicating the adhesive wicked 5% into the carbon foam from edge to centre. These estimations were determined from ten measurements using the 2D images.
Figure 5 shows a section deeper into the carbon foam, revealing that the adhesive was both present and absent toward the bottom edges of the carbon foam.
3.2 Sample B – cubic support
X-ray CT sections of Sample B are given in Figures 7 and 8. The cubic polythene support forms the outermost structure. The extent of adhesive wicking in Sample B was $26\pm 1.0~\unicode[STIX]{x03BC}\text{m}$, indicating the adhesive wicked 6.5% into the carbon foam from edge to centre. Figure 7 reveals that the adhesive was both present and absent toward the bottom edges of the carbon foam.
3.3 Adhesive distribution
The adhesive distribution within Samples A and B are shown in Figures 9 and 10, respectively. These volume-rendered images provide easier visual representations of the adhesive morphology compared with the conventional X-ray CT images for the samples investigated. X-ray CT data consists of pixels with variable intensity levels. The data was imported into the image processing software. A median filter was used to smooth data, assigning the median value intensity over two neighbouring pixels. Segmentation of the smoothed data was used to discriminate the adhesive intensity distribution from the carbon foam and polythene support. Volume rendering was used to define the entirety of the volume of adhesive.
The volume of adhesive associated with Sample A was $9.07\times 10^{-3}~\text{mm}^{3}$ and $10.89\times 10^{-3}~\text{mm}^{3}$ for Sample B, which is equivalent to spherical diameter of 260 and $275~\unicode[STIX]{x03BC}\text{m}$, respectively. However, this estimate is based on the total adhesive, a combination of wicked and detached components, and were determined using the 3D volume-rendered images.
The accuracy of the measurements is dependent on a number of factors associated with the X-ray CT hardware, reconstruction and image processing software. X-ray CT hardware error factors include source stability, detector characteristics and geometrical errors associated with source, detector and rotation stage. Operator parameters include the selection of suitable accelerating voltage (kV) of the X-ray tube which determines the X-ray energies current $(\unicode[STIX]{x03BC}\text{A})$; settings which control the X-ray flux; the exposure time and the number of projections which define counting statistics and image signal/noise ratio, respectively. Environmental errors include variations with temperature and humidity. Image processing errors include the selection of smoothing filters, threshold determination and inadequate data sampling. To improve accuracy in the measurements, it is recommended that further work be undertaken to understand the uncertainties and errors. This will include the development of calibrated workpieces and procedures for X-ray CT dimensional metrology[6].
It is important at this time to know the extent of the wicking of the adhesive into the pores of the foam as this can then be compensated for in the physics models used to support the understanding of the target once shot in a laser facility.
4 Conclusion
It has been successfully demonstrated that X-ray tomography is a viable nondestructive method for assessing both internal and external surfaces for a multimaterial adhesively bonded target assembly.
The complex distribution of adhesive into carbon foams was investigated for two samples. Volume-rendered images determined the quantities and distribution of the adhesive. The extent of wicking was found to be similar for the two samples; in both cases, adhesive was not present toward the bottom edges in the deeper sections of the carbon foam. The central region of the carbon foam is adhesive free, providing reassurance that experimental design is not compromised.
The combination of X-ray tomography and image processing provides an effective tool for assessing the suitability of adhesively bonded multicomponent targets for plasma physics experiments. Furthermore these nondestructive in situ assessments were novel work, enhancing and developing characterization capability for complex material target assemblies.
References
[1]
[2] K. O’Nions, R. Pitman, C. March. Nature, 415, 835(2002).
[3] G. H. Miller, E. I. Moses, C. R. Wuest. Opt. Eng., 43, 2841(2004).
[4] N. Hopps, K. Oades, J. Andrew, C. Brown, G. Cooper, C. Danson, S. Daykin, S. Duffield, R. Edwards, D. Egan, S. Elsmere, S. Gales, M. Girling, E. Gumbrell, E. Harvey, D. Hillier, D. Hoarty, C. Horsfield, S. James, A. Leatherland, S. Masoero, A. Meadowcroft, M. Norman, S. Parker, S. Rothman, M. Rubery, P. Treadwell, D. Winter, T. Bett. Plasma Phys. Control. Fusion, 57(2015).
[5] S. W. Wilkins, T. E. Gureyv, D. Gao, A. Pogany, A. W. Stevenson. Nature, 384, 335(1996).
[6] Alexandra Kraemer, Gisela Lanza. Procedia CIRP, 43, 362(2016).