• High Power Laser Science and Engineering
  • Vol. 6, Issue 2, 02000e29 (2018)
Jianqiang Zhu1、2, Xinglong Xie1、2、*, Meizhi Sun1、2, Jun Kang1、2, Qingwei Yang1、2, Ailin Guo1、2, Haidong Zhu1、2, Ping Zhu1、2, Qi Gao1、2, Xiao Liang1、2、3, Ziruo Cui1、2、3, Shunhua Yang1、2、3, Cheng Zhang1、2、3, and Zunqi Lin1、2
Author Affiliations
  • 1National Laboratory on High Power Laser and Physics, Shanghai 201800, China
  • 2Shanghai Institute of Optics and Fine Mechanics, Chinese Academy of Sciences, Shanghai 201800, China
  • 3University of Chinese Academy of Sciences, Beijing 100049, China
  • show less
    DOI: 10.1017/hpl.2018.23 Cite this Article Set citation alerts
    Jianqiang Zhu, Xinglong Xie, Meizhi Sun, Jun Kang, Qingwei Yang, Ailin Guo, Haidong Zhu, Ping Zhu, Qi Gao, Xiao Liang, Ziruo Cui, Shunhua Yang, Cheng Zhang, Zunqi Lin. Analysis and construction status of SG-II 5PW laser facility[J]. High Power Laser Science and Engineering, 2018, 6(2): 02000e29 Copy Citation Text show less
    Layout of the SG series laser facilities.
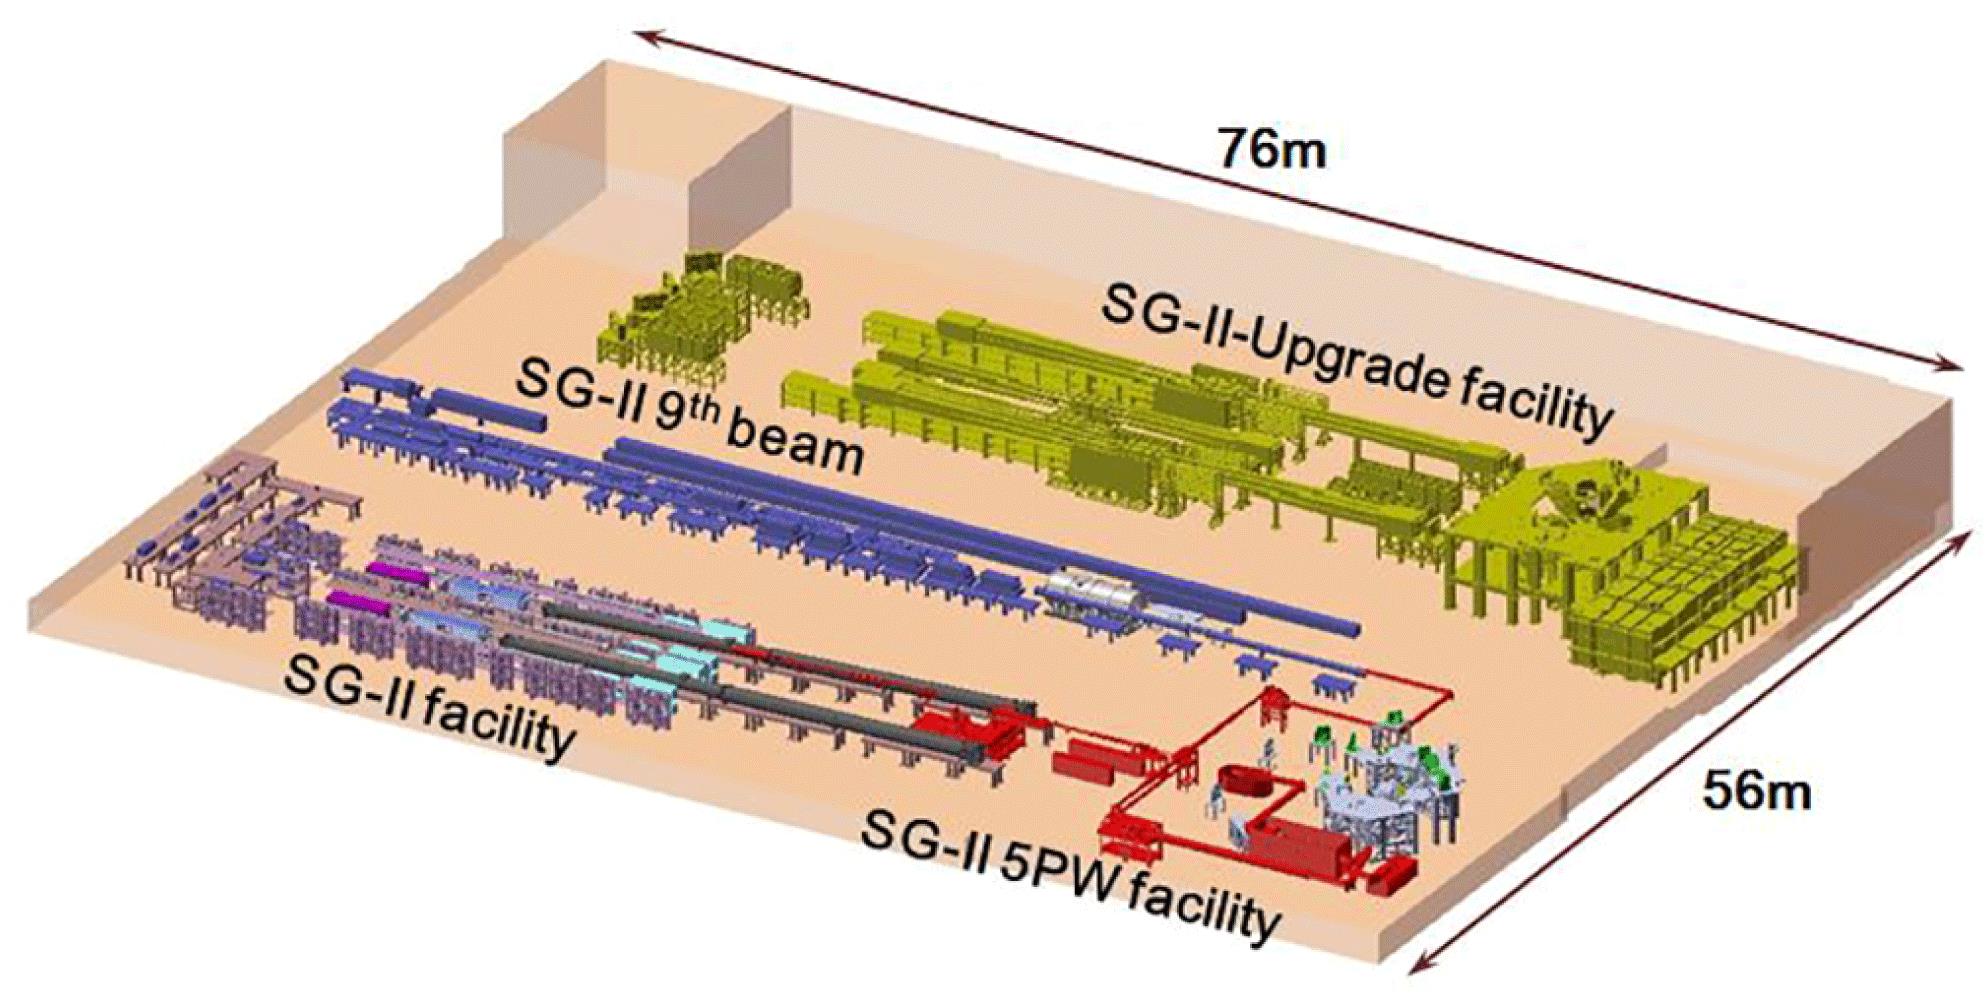
    Fig. 1. Layout of the SG series laser facilities.
    Schematic of the SG-II 5PW laser facility. AO: adaptive optics; HS: Hartmann sensor; DM: deformable mirror; OAP: off-axis parabolic mirror; AWG: arbitrary waveform generator; FM: frequency modulator.
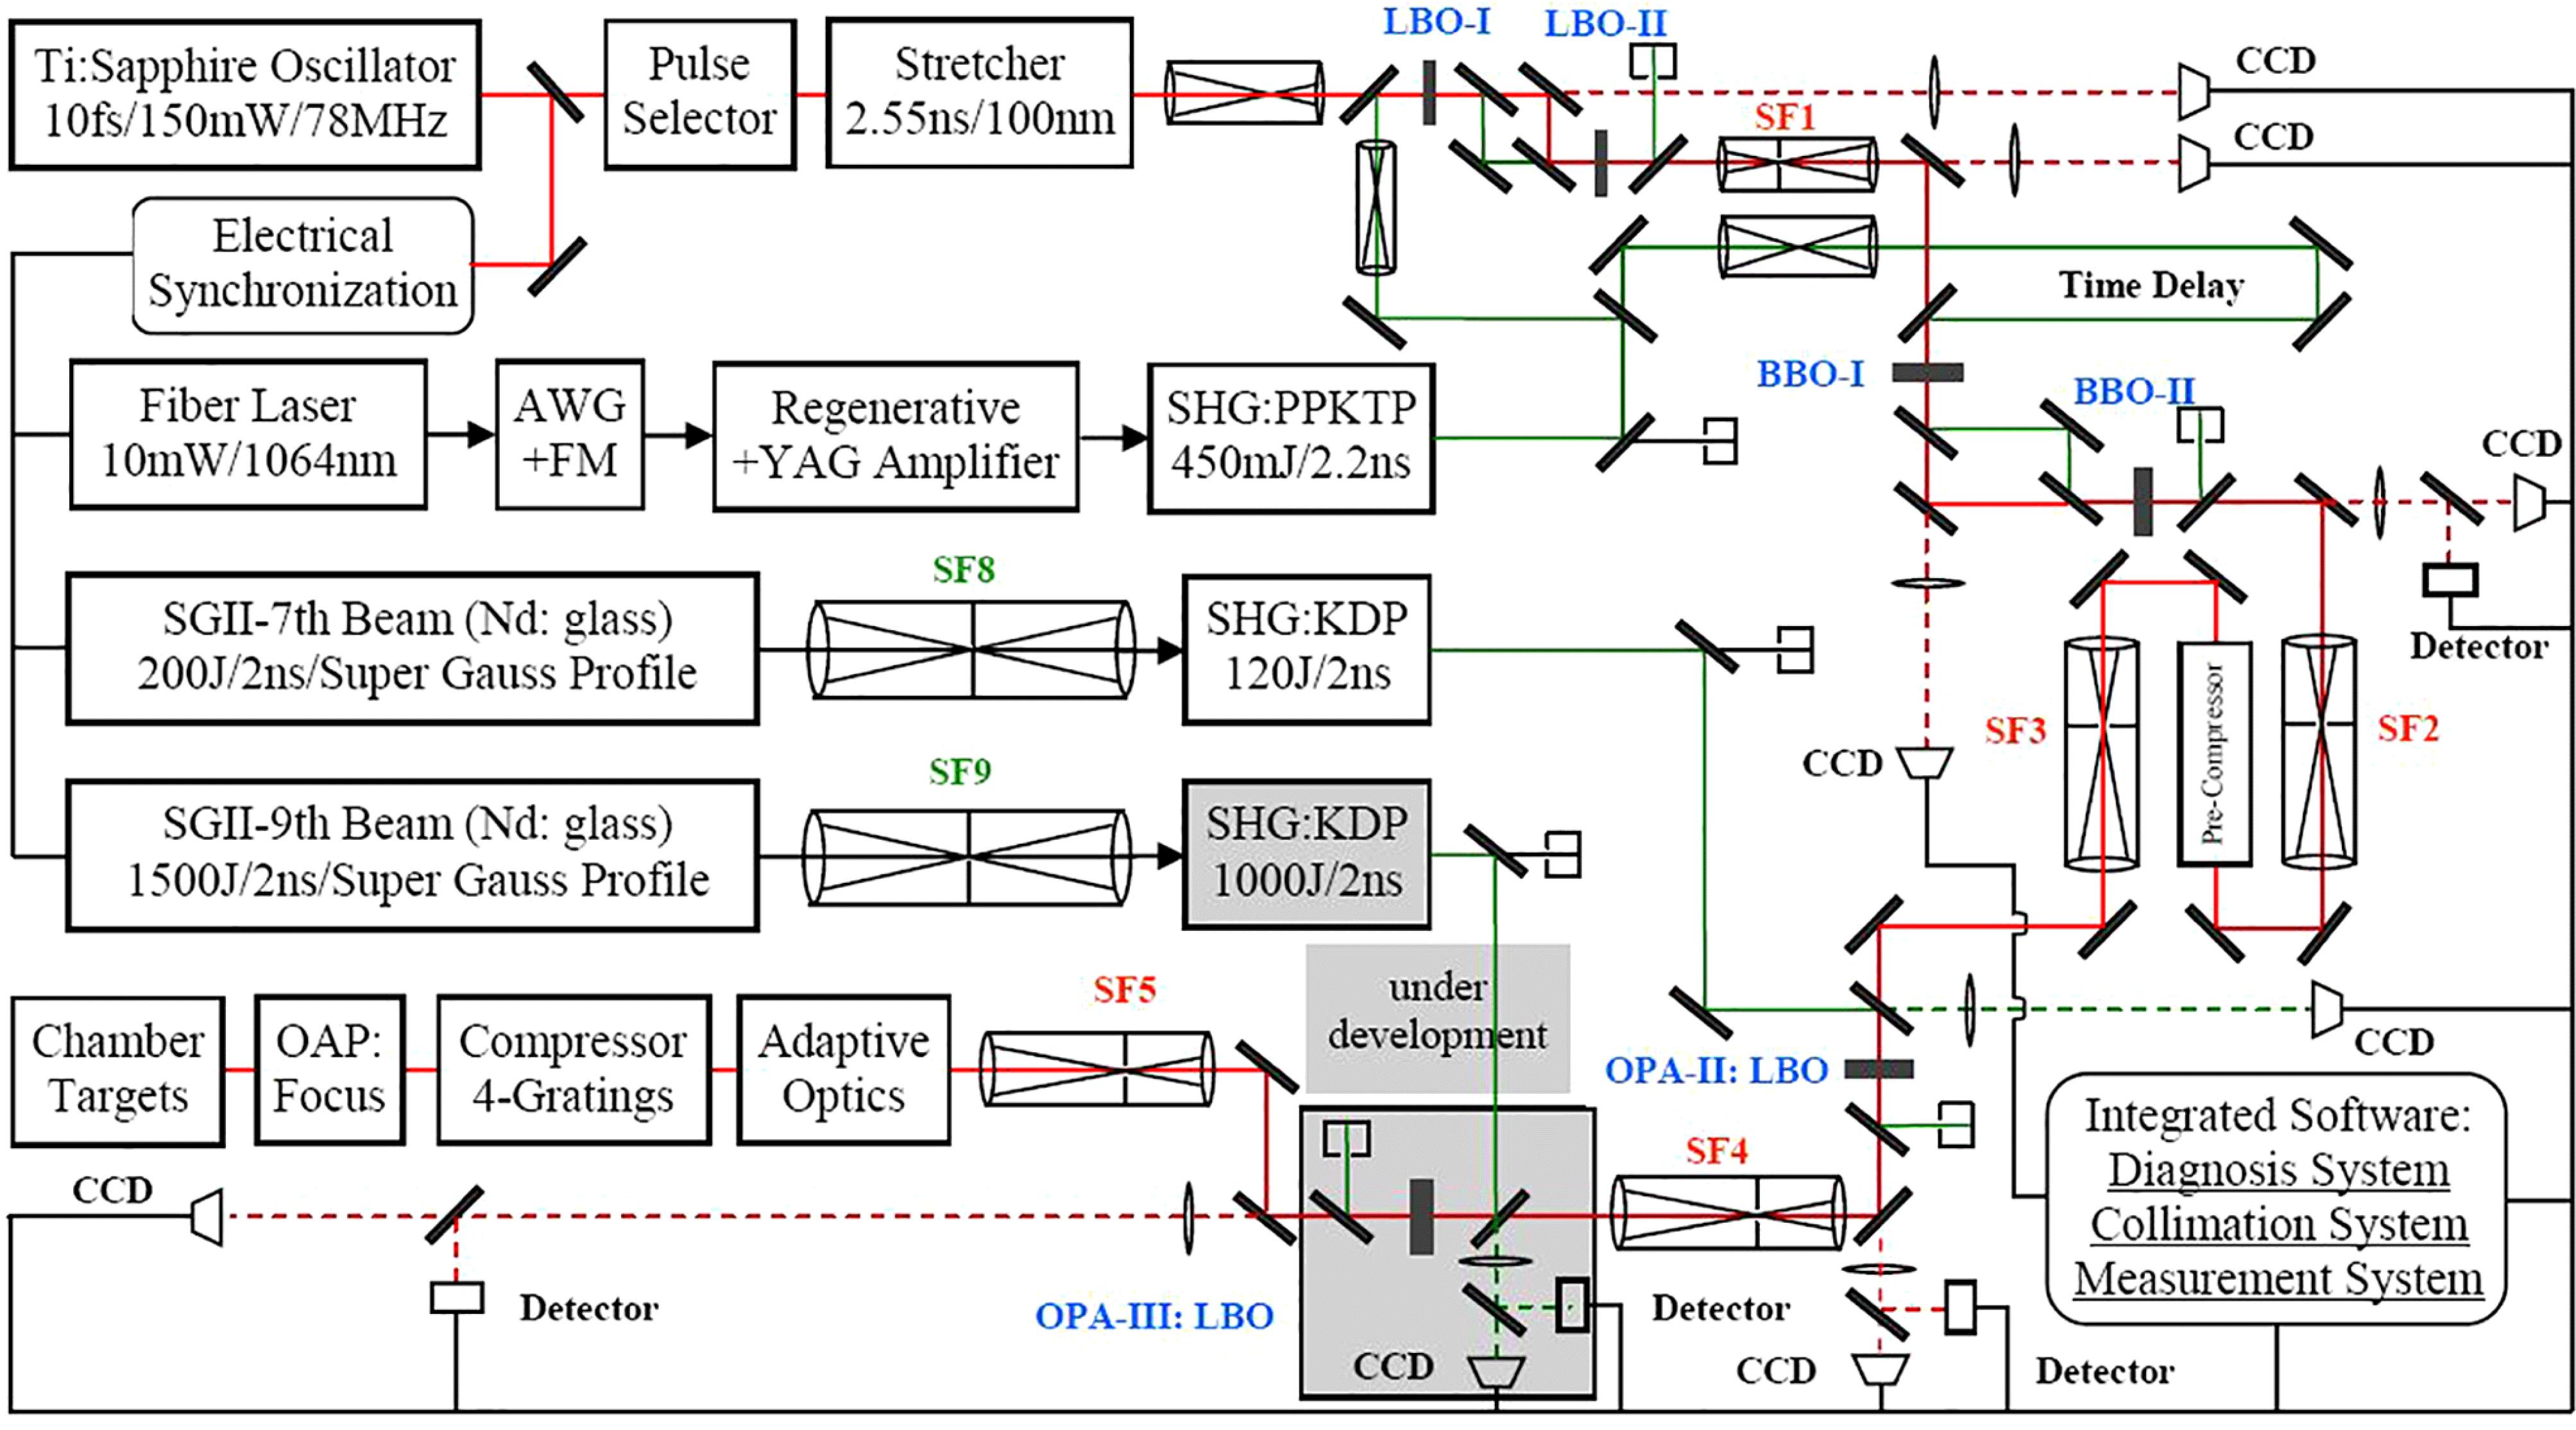
    Fig. 2. Schematic of the SG-II 5PW laser facility. AO: adaptive optics; HS: Hartmann sensor; DM: deformable mirror; OAP: off-axis parabolic mirror; AWG: arbitrary waveform generator; FM: frequency modulator.
    Four-pass Öffner stretcher (left), laser based on Nd:YAG (middle) and first stage OPCPA on operation (right).
    Fig. 3. Four-pass Öffner stretcher (left), laser based on Nd:YAG (middle) and first stage OPCPA on operation (right).
    Waveforms of the pump pulses for OPA-I and OPA-II.
    Fig. 4. Waveforms of the pump pulses for OPA-I and OPA-II.
    Waveforms of the chirped signal pulse along the current amplification chain.
    Fig. 5. Waveforms of the chirped signal pulse along the current amplification chain.
    Signal pulse spectra for different amplification stages.
    Fig. 6. Signal pulse spectra for different amplification stages.
    (a) Normalized near-field distribution and (b) far-field focal spot of OPA-I.
    Fig. 7. (a) Normalized near-field distribution and (b) far-field focal spot of OPA-I.
    SG-II laser facility (left), a large-aperture KDP crystal (as a second harmonic generator (middle)), and a large-aperture LBO crystal in the second OPCPA stage (right).
    Fig. 8. SG-II laser facility (left), a large-aperture KDP crystal (as a second harmonic generator (middle)), and a large-aperture LBO crystal in the second OPCPA stage (right).
    (a) Near-field distributions of the pump at location of LBO crystal and (b) signal pulse after the master compressor.
    Fig. 9. (a) Near-field distributions of the pump at location of LBO crystal and (b) signal pulse after the master compressor.
    Statistics of the pump and signal pulses energy as well as the pump-to-signal conversion efficiency for all shots of the OPA-II.
    Fig. 10. Statistics of the pump and signal pulses energy as well as the pump-to-signal conversion efficiency for all shots of the OPA-II.
    (a) Amplified signal energy fluctuation for various pumps, (b) conversion efficiency, and (c) FF (red line) and FBC (blue line) along the LBO length in the OPCPA-II; the dotted lines in (c) are borderlines of the four intervals.
    Fig. 11. (a) Amplified signal energy fluctuation for various pumps, (b) conversion efficiency, and (c) FF (red line) and FBC (blue line) along the LBO length in the OPCPA-II; the dotted lines in (c) are borderlines of the four intervals.
    FF (red line) and FBC (blue line) for the OPCPA-II amplified signal as a function of the crystal length that correspond to the amplification (a) with the ideal spatial–temporal super-Gaussian pump pulse and actual signal pulse and (b) that with the ideal spatial–temporal super-Gaussian signal pulse and actual pump pulse, respectively.
    Fig. 12. FF (red line) and FBC (blue line) for the OPCPA-II amplified signal as a function of the crystal length that correspond to the amplification (a) with the ideal spatial–temporal super-Gaussian pump pulse and actual signal pulse and (b) that with the ideal spatial–temporal super-Gaussian signal pulse and actual pump pulse, respectively.
    Compressor tank (left) and an inner image of the gold-coated gratings (right).
    Fig. 13. Compressor tank (left) and an inner image of the gold-coated gratings (right).
    Compressed pulse duration with the whole beam diameter.
    Fig. 14. Compressed pulse duration with the whole beam diameter.
    Profile measured by a third-order cross-correlator with the whole beam diameter.
    Fig. 15. Profile measured by a third-order cross-correlator with the whole beam diameter.
    Deformable mirror (left) and Hartmann sensor (right) in AO system.
    Fig. 16. Deformable mirror (left) and Hartmann sensor (right) in AO system.
    The measured static aberrations (a) before and (b) after correction, and (c) the pre-compensated dynamic aberrations when the amplifiers are on operation at the master compressor entrance; (d), (e) and (f) the calculated encircled energy and the profiles of far-field focal spot, respectively, corresponding to (a), (b) and (c).
    Fig. 17. The measured static aberrations (a) before and (b) after correction, and (c) the pre-compensated dynamic aberrations when the amplifiers are on operation at the master compressor entrance; (d), (e) and (f) the calculated encircled energy and the profiles of far-field focal spot, respectively, corresponding to (a), (b) and (c).
    Target chamber.
    Fig. 18. Target chamber.
    After the AO correction, (a) the focal spot of the unamplified signal pulse imaged by a CCD and (b) that of the high energy pulse imaged by an X-ray pinhole camera.
    Fig. 19. After the AO correction, (a) the focal spot of the unamplified signal pulse imaged by a CCD and (b) that of the high energy pulse imaged by an X-ray pinhole camera.
    (a) 3D ray tracing of OAP; focal spot size increase (b) as a function of the angular deviation of the incident light and (c) as a function of the deviation from the focal plane.
    Fig. 20. (a) 3D ray tracing of OAP; focal spot size increase (b) as a function of the angular deviation of the incident light and (c) as a function of the deviation from the focal plane.
    FacilityOutput capabilityFeatures and current status
    SG-II facility2.4 kJ/1 ns//8 beams/20 cm; 6 kJ/1 ns//8 beams/20 cm; several joules/100 ps//1 beam.Precise and stable operation. The 7th beam is used as pump laser for OPA-II of SG-II 5PW.
    SG-II 9th beam5.13 kJ/3.4 ns//32 cm; 3 kJ/3.4 ns//32 cm; probe laser: 30 ps, 80 ps, 120 ps–5 ns.Multi-functional laser system. It will be used as pump laser for OPA-III of SG-II 5PW.
    SG-II-UP facilityEight nanosecond beams: 8.05 kJ/5 ns//beam (maximal); 40 kJ/3.3 ns//8 beams (routine); 25 kJ/3.3 ns//8 beams (routine). One picosecond petawatt beam: 1 kJ/(1–)/() /. One prototype beam: 16 kJ/5 ns//; 17.5 kJ/20 ns//.Good beam quality. Fine controlling ability. Large energy. High fluence density.
    SG-II 5 PW facility 150 J/30 fs/5 PW/808 nm (designed); 37 J/21 fs/1.76 PW (prior two phases).The OPA-III as the third phase is under development.
    Table 1. The output capability and features of SG series laser facilities.
    Crystal length (mm) Signal energy (J) Chirped duration (ns) Spectrum bandwidth (nm) Conversion efficiency Compressed duration (fs) Compressed power (PW)
    DKDP351.36237%5
    LBO1328545%20
    Table 2. Comparison between LBO and DKDP calculations in OPA-III.
    SF1SF2SF3SF4SF5
    Size of incident beam (mm)
    Focal length of incidence lens (mm)240 700 40024802860
    Focal length of output lens (mm)9601930150060005720
    Size of output beam (mm)
    Propagation time difference (fs) 2 5 78 127 566
    Table 3. Design of multiple-stage spatial filters in SG-II 5PW system.
    Jianqiang Zhu, Xinglong Xie, Meizhi Sun, Jun Kang, Qingwei Yang, Ailin Guo, Haidong Zhu, Ping Zhu, Qi Gao, Xiao Liang, Ziruo Cui, Shunhua Yang, Cheng Zhang, Zunqi Lin. Analysis and construction status of SG-II 5PW laser facility[J]. High Power Laser Science and Engineering, 2018, 6(2): 02000e29
    Download Citation