
Chaoyong Chen, Chunqing Gao, Huixing Dai, Qing Wang. Single-frequency Er:YAG ceramic pulsed laser with frequency stability close to 100 kHz[J]. Chinese Optics Letters, 2022, 20(4): 041402
- Chinese Optics Letters
- Vol. 20, Issue 4, 041402 (2022)
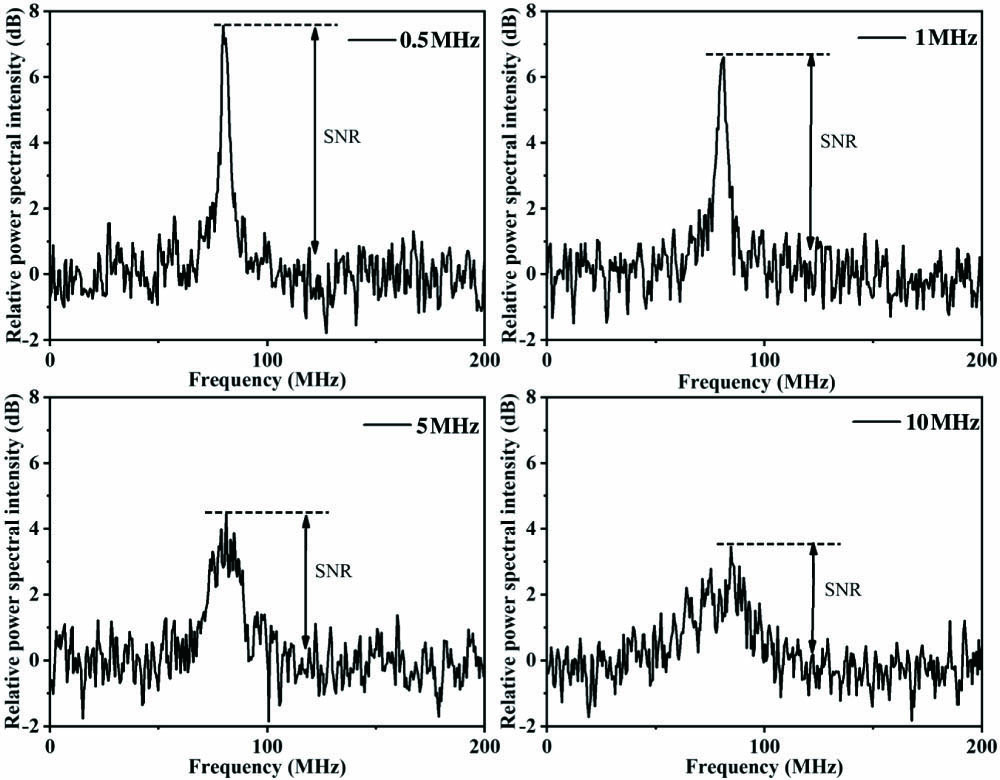
Fig. 1. Simulation of the Doppler lidar echo signals’ relative power spectrum data with pulse frequency stability of 0.5 MHz, 1 MHz, 5 MHz, and 10 MHz. The lidar emits Gaussian pulses with the wavelength of λ = 1645 nm, SNRsp = -10 dB, f = 80 MHz, 1/Ts = 500 MHz, ΔT = 200 ns, and the cumulative number of pulses is 100.
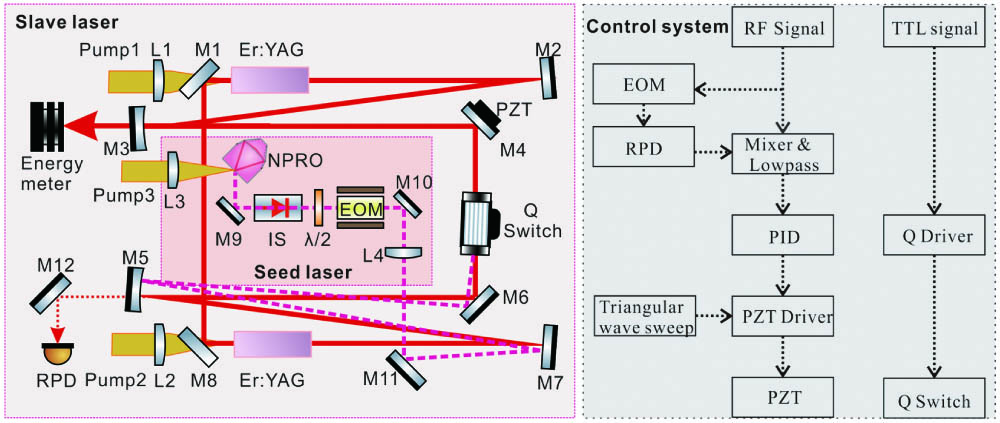
Fig. 2. Experimental setup of a frequency stabilized, Q-switched 1645 nm ceramic Er:YAG laser based on the PDH method. NPRO, nonplanar ring oscillator seed laser; HWP, half-wave plate; EOM, electro-optic phase modulator; AOM, acousto-optic Q-switch; PZT, piezoelectric transducer; PID, proportional-integral-differential controller; RPD, resonant photo-detector.
Fig. 3. Pulse energies at different PRRs of 100 Hz, 200 Hz, 300 Hz, 400 Hz, and 500 Hz.
Fig. 4. (a) Single-shot beat note signal and (b) its FFT at the PRR of 300 Hz. (c) Single-frequency pulse waveform diagram.
Fig. 5. Recorded center frequencies of the beat note signals (left) and their distributions (right) at different pulse repetition frequencies of 100 Hz, 200 Hz, 300 Hz, 400 Hz, and 500 Hz.
Fig. 6. Allan plot for pulse frequencies at different PRRs.
Fig. 7. Beam quality of the single-frequency pulses at the PRR of 300 Hz.

Set citation alerts for the article
Please enter your email address
© Copyright 2018-2021 | Chinese Laser Press. All Rights Reserved 沪ICP备15018463号-20