• Photonics Research
  • Vol. 10, Issue 10, 2359 (2022)
Zhiwei Ma1、2、*, Junxia Hu3, Liping Tang3, and Bingbing Lyu4
Author Affiliations
  • 1Center of Materials Science and Optoelectronics Engineering, University of Chinese Academy of Sciences, Beijing 100049, China
  • 2Key Laboratory for Special Functional Materials of the Ministry of Education, Henan University, Kaifeng 475004, China
  • 3School of Information Engineering, Xinyang Agriculture and Forestry University, Xinyang 464000, China
  • 4Department of Physics, South University of Science and Technology, Shenzhen 518055, China
  • show less
    DOI: 10.1364/PRJ.462852 Cite this Article Set citation alerts
    Zhiwei Ma, Junxia Hu, Liping Tang, Bingbing Lyu. Taming quantum dots’ nucleation and growth enables stable and efficient blue-light-emitting devices[J]. Photonics Research, 2022, 10(10): 2359 Copy Citation Text show less
    (a) Schematic diagram of the preparation process of ZnxCd1−xSeyS1−y cores and gradient ZnCdSeS/ZnS alloy QDs with different emissions and nanostructures. (b) ZnCdSeS/ZnS alloy QDs with the evolution of spectra from violet to yellow. Inset: PL images of ZnCdSeS/ZnS alloy QDs with different emission colors. (c) Full width at half maximum (FWHM) and (d) PL QY of ZnCdSeS/ZnS alloy QDs with the given peak. (e) Zn/Cd and S/Se composition ratio of ZnxCd1−xSeyS1−y cores based on ICP-OES data.
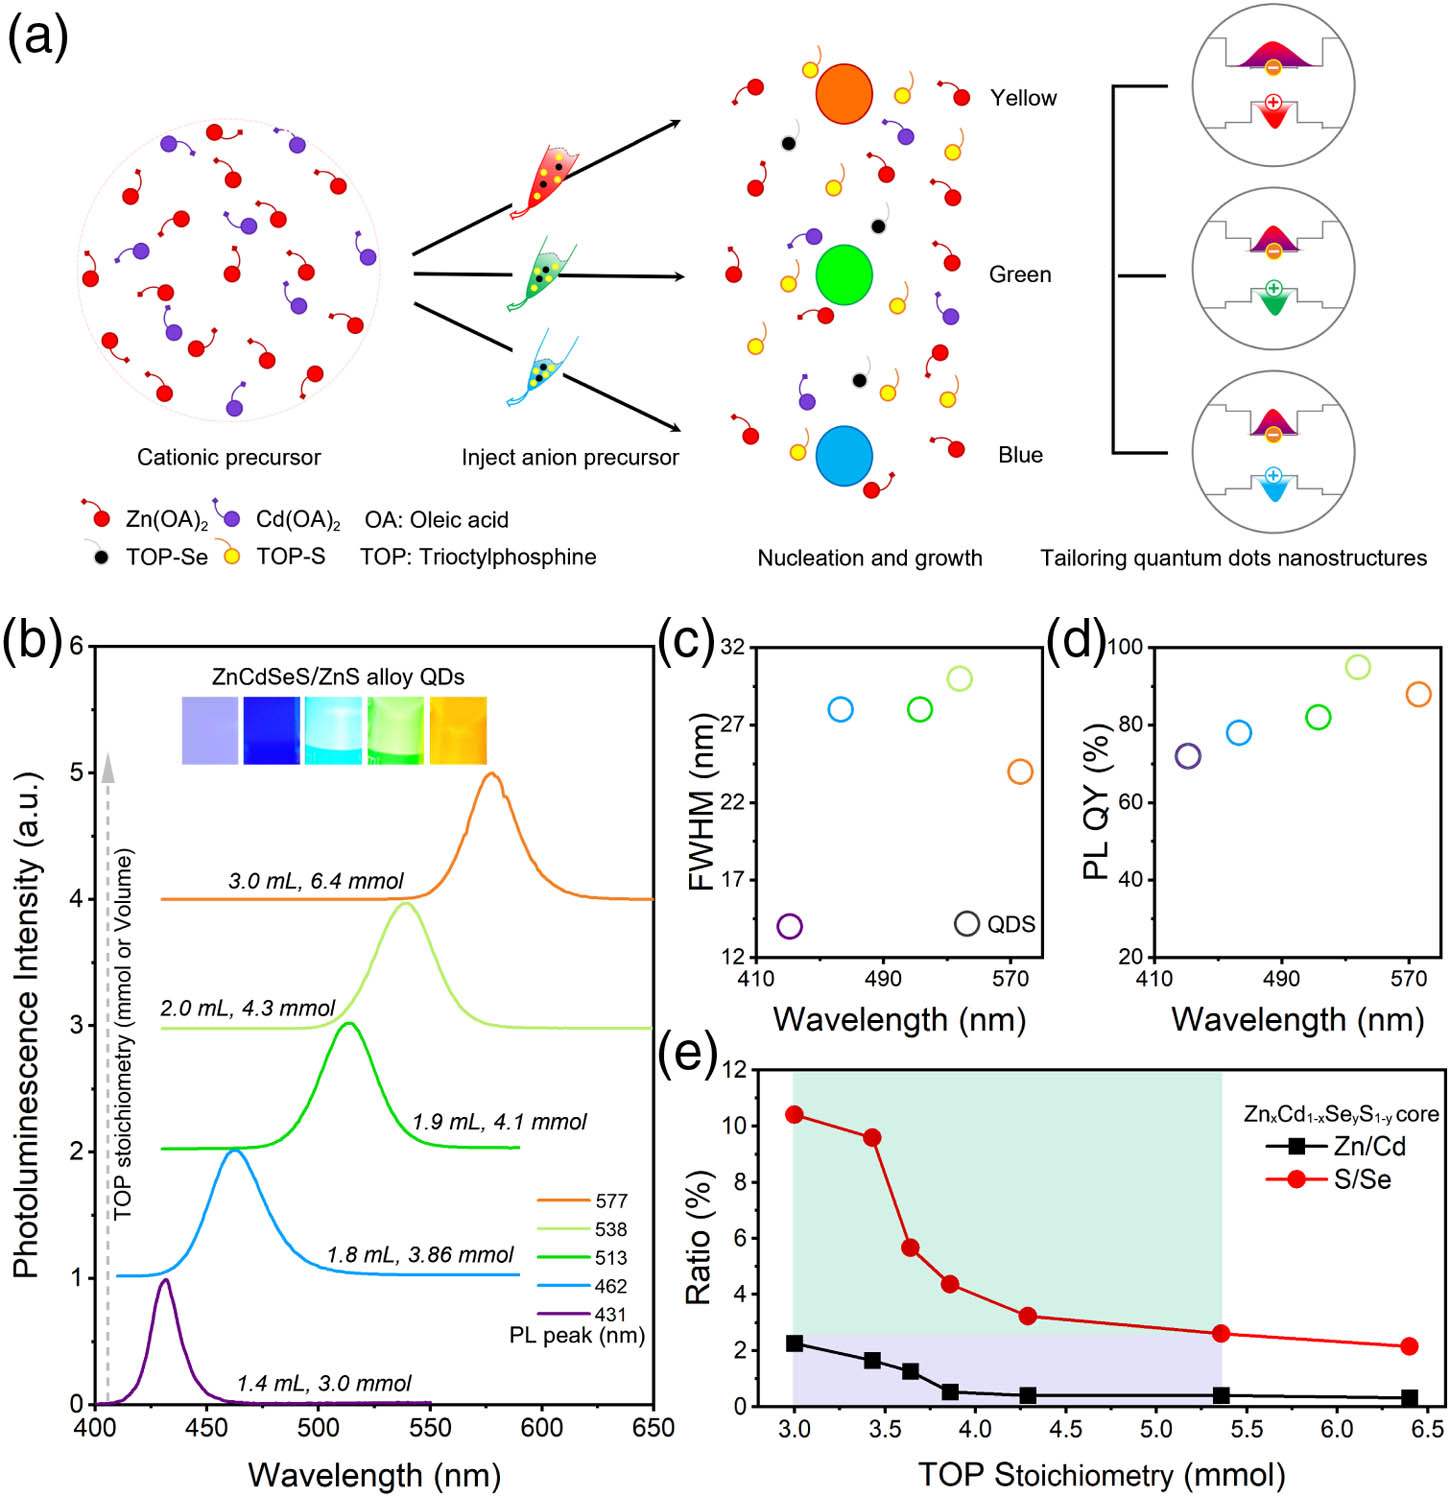
    Fig. 1. (a) Schematic diagram of the preparation process of ZnxCd1xSeyS1y cores and gradient ZnCdSeS/ZnS alloy QDs with different emissions and nanostructures. (b) ZnCdSeS/ZnS alloy QDs with the evolution of spectra from violet to yellow. Inset: PL images of ZnCdSeS/ZnS alloy QDs with different emission colors. (c) Full width at half maximum (FWHM) and (d) PL QY of ZnCdSeS/ZnS alloy QDs with the given peak. (e) Zn/Cd and S/Se composition ratio of ZnxCd1xSeyS1y cores based on ICP-OES data.
    Time-dependent PL spectra of (a) blue-violet, (b) blue, and (c) sky-blue ZnCdSeS/ZnS alloy QDs. Inset: schematic of QDs’ energy alignments and exciton delocalization. (d) Time-resolved PL decay kinetics, (e) temperature-dependent PL peak, and (f) intensity of blue-violet, blue, and sky-blue ZnCdSeS/ZnS alloy QDs.
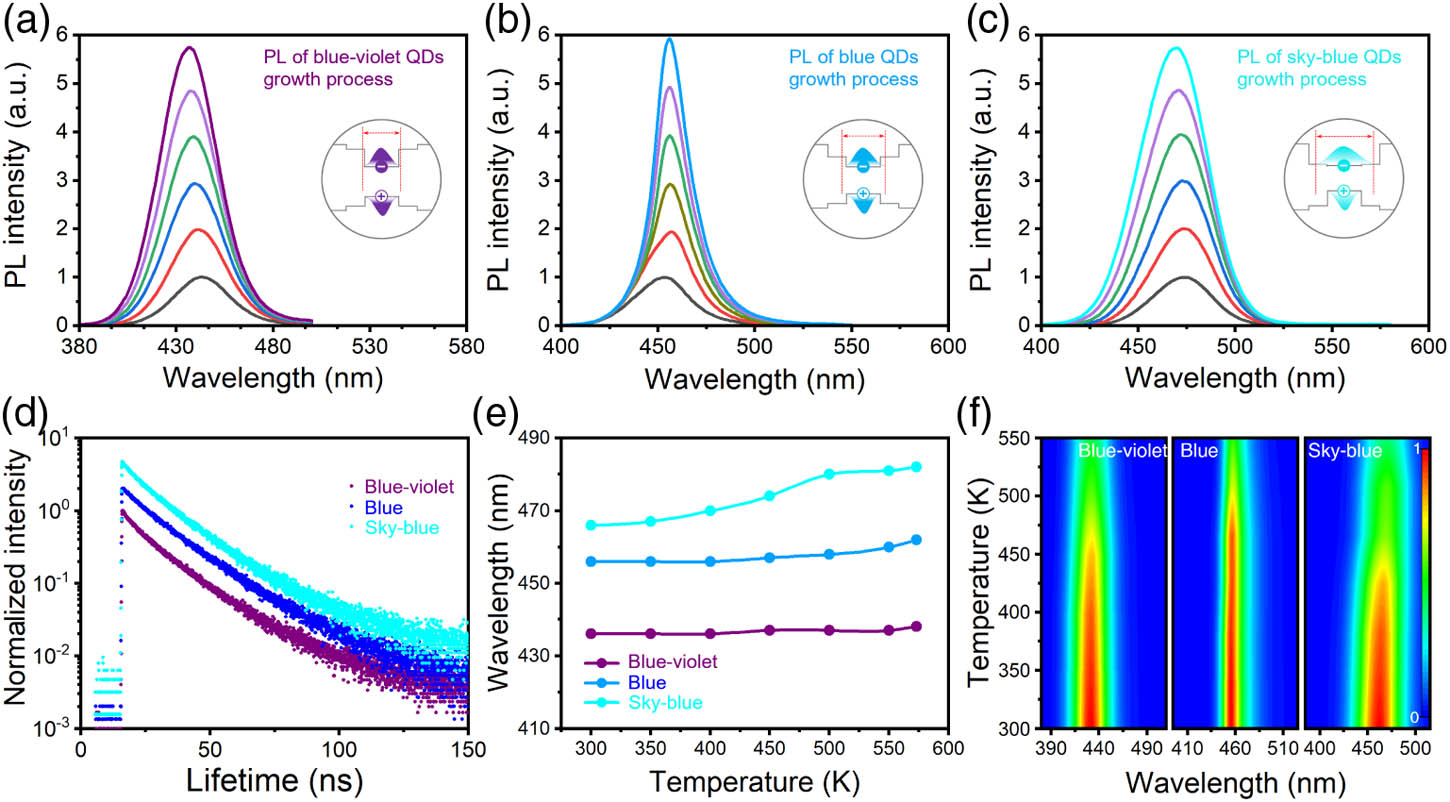
    Fig. 2. Time-dependent PL spectra of (a) blue-violet, (b) blue, and (c) sky-blue ZnCdSeS/ZnS alloy QDs. Inset: schematic of QDs’ energy alignments and exciton delocalization. (d) Time-resolved PL decay kinetics, (e) temperature-dependent PL peak, and (f) intensity of blue-violet, blue, and sky-blue ZnCdSeS/ZnS alloy QDs.
    (a) Schematic illustrating the structure and (b) energy level diagram of QLEDs. (c) Ultraviolet photoelectron spectroscopy of blue-violet, blue, and sky-blue QDs. (d) Current–voltage measurements for hole-only devices, where the devices were formed from sky-blue, blue, and blue-violet QDs. (e) Current density luminance versus driving voltage characteristics and (f) EQE as a function of luminance of the performing QLEDs based on blue-violet, blue, and sky-blue QDs.
    Fig. 3. (a) Schematic illustrating the structure and (b) energy level diagram of QLEDs. (c) Ultraviolet photoelectron spectroscopy of blue-violet, blue, and sky-blue QDs. (d) Current–voltage measurements for hole-only devices, where the devices were formed from sky-blue, blue, and blue-violet QDs. (e) Current density luminance versus driving voltage characteristics and (f) EQE as a function of luminance of the performing QLEDs based on blue-violet, blue, and sky-blue QDs.
    AFM measurements show the root mean square (RMS) roughness for the following layers: (a) PEDOT:PSS, (b) TFB, and (c) ZnO. RMS of (d) sky-blue, (e) blue, and (f) blue-violet ZnCdSeS/ZnS alloy QDs.
    Fig. 4. AFM measurements show the root mean square (RMS) roughness for the following layers: (a) PEDOT:PSS, (b) TFB, and (c) ZnO. RMS of (d) sky-blue, (e) blue, and (f) blue-violet ZnCdSeS/ZnS alloy QDs.
    (a) EL spectra and photographs of QLEDs, and (b) corresponding CIE coordinates of the three QLEDs. (c) Luminance versus time of operation under ambient conditions of blue-violet, blue, and sky-blue QLEDs.
    Fig. 5. (a) EL spectra and photographs of QLEDs, and (b) corresponding CIE coordinates of the three QLEDs. (c) Luminance versus time of operation under ambient conditions of blue-violet, blue, and sky-blue QLEDs.
    (a)–(e) TEM images of ZnxCd1−xSeyS1−y cores with emission spectra from violet to yellow, respectively. Inset shows the size distribution of the ZnxCd1−xSeyS1−y cores.
    Fig. 6. (a)–(e) TEM images of ZnxCd1xSeyS1y cores with emission spectra from violet to yellow, respectively. Inset shows the size distribution of the ZnxCd1xSeyS1y cores.
    (a)–(e) TEM images of ZnCdSeS/ZnS with emission spectra from violet to yellow, respectively. Inset shows the size distribution of QDs. Scale bar: 20 nm.
    Fig. 7. (a)–(e) TEM images of ZnCdSeS/ZnS with emission spectra from violet to yellow, respectively. Inset shows the size distribution of QDs. Scale bar: 20 nm.
    X-ray powder diffraction pattern of zinc-blende ZnCdSeS/ZnS QDs with emission spectra from violet to yellow.
    Fig. 8. X-ray powder diffraction pattern of zinc-blende ZnCdSeS/ZnS QDs with emission spectra from violet to yellow.
    TEM Images of (a) blue-violet, (b) blue, and (c) sky-blue ZnCdSeS/ZnS alloy QDs. Inset shows the size distribution of ZnCdSeS/ZnS alloy QDs.
    Fig. 9. TEM Images of (a) blue-violet, (b) blue, and (c) sky-blue ZnCdSeS/ZnS alloy QDs. Inset shows the size distribution of ZnCdSeS/ZnS alloy QDs.
    TOP (mmol)ZnCdSeSQD Core Composition
    3.000.690.310.080.92Zn0.69Cd0.31Se0.08S0.92
    3.430.620.380.090.91Zn0.62Cd0.38Se0.09S0.91
    3.640.560.440.150.85Zn0.56Cd0.44Se0.15S0.85
    3.860.350.660.190.81Zn0.35Cd0.65Se0.19S0.81
    4.290.290.710.240.76Zn0.29Cd0.71Se0.24S0.76
    5.360.20.710.280.72Zn0.29Cd0.71Se0.28S0.72
    6.430.240.760.320.68Zn0.24Cd0.76Se0.32S0.68
    Table 1. ZnxCd1−xSeyS1−y Cores with a Chemical Composition
    Colorτ1 (ns)τ2 (ns)f1 (%)f2 (%)T (ns)χR2
    Sky-blue8.7419.6327.5472.4616.61.11
    Blue6.2317.7319.3180.6915.51.23
    Blue-violet6.4618.7223.4776.5315.81.25
    Table 2. Lifetimes and Fractional Contribution of Different PL Decay Channels for Sky-Blue, Blue, and Blue-Violet ZnCdSeS/ZnS Alloy QDs in Solutiona
    QDsEL (nm)Lmax (cd/m2)Peak EQE (%)Lifetime (h) at 100cd/m2Reference
    ZnCdS/ZnS455400010.7<1000[9]
    468489019.847.4[14]
    ZnxCd1xS/ZnS445450015.647 (420cd/m2)[39]
    ZnCdSe/ZnS/ZnS47914,10016.2355[40]
    ZnCdSe/ZnSe48262,6008.057000[10]
    CdZnS/ZnS45427,7538.92[18]
    CdSeS/ZnSeS/ZnS483/1010,000[41]
    ZnCdSeS/ZnS443644210.03813This work
    46214,39015.810,420
    47221,13013.411,287
    Table 3. Summary of EL Performance, Maximum Luminance (Lmax), EQE, and Lifetime of Optimized Best Performing QLEDs
    Zhiwei Ma, Junxia Hu, Liping Tang, Bingbing Lyu. Taming quantum dots’ nucleation and growth enables stable and efficient blue-light-emitting devices[J]. Photonics Research, 2022, 10(10): 2359
    Download Citation