
Qiaozhi He, Rongjun Shao, Yuan Qu, Linxian Liu, Chunxu Ding, Jiamiao Yang, "Complex transmission matrix retrieval for a highly scattering medium via regional phase differentiation," Photonics Res. 12, 876 (2024)
- Photonics Research
- Vol. 12, Issue 5, 876 (2024)
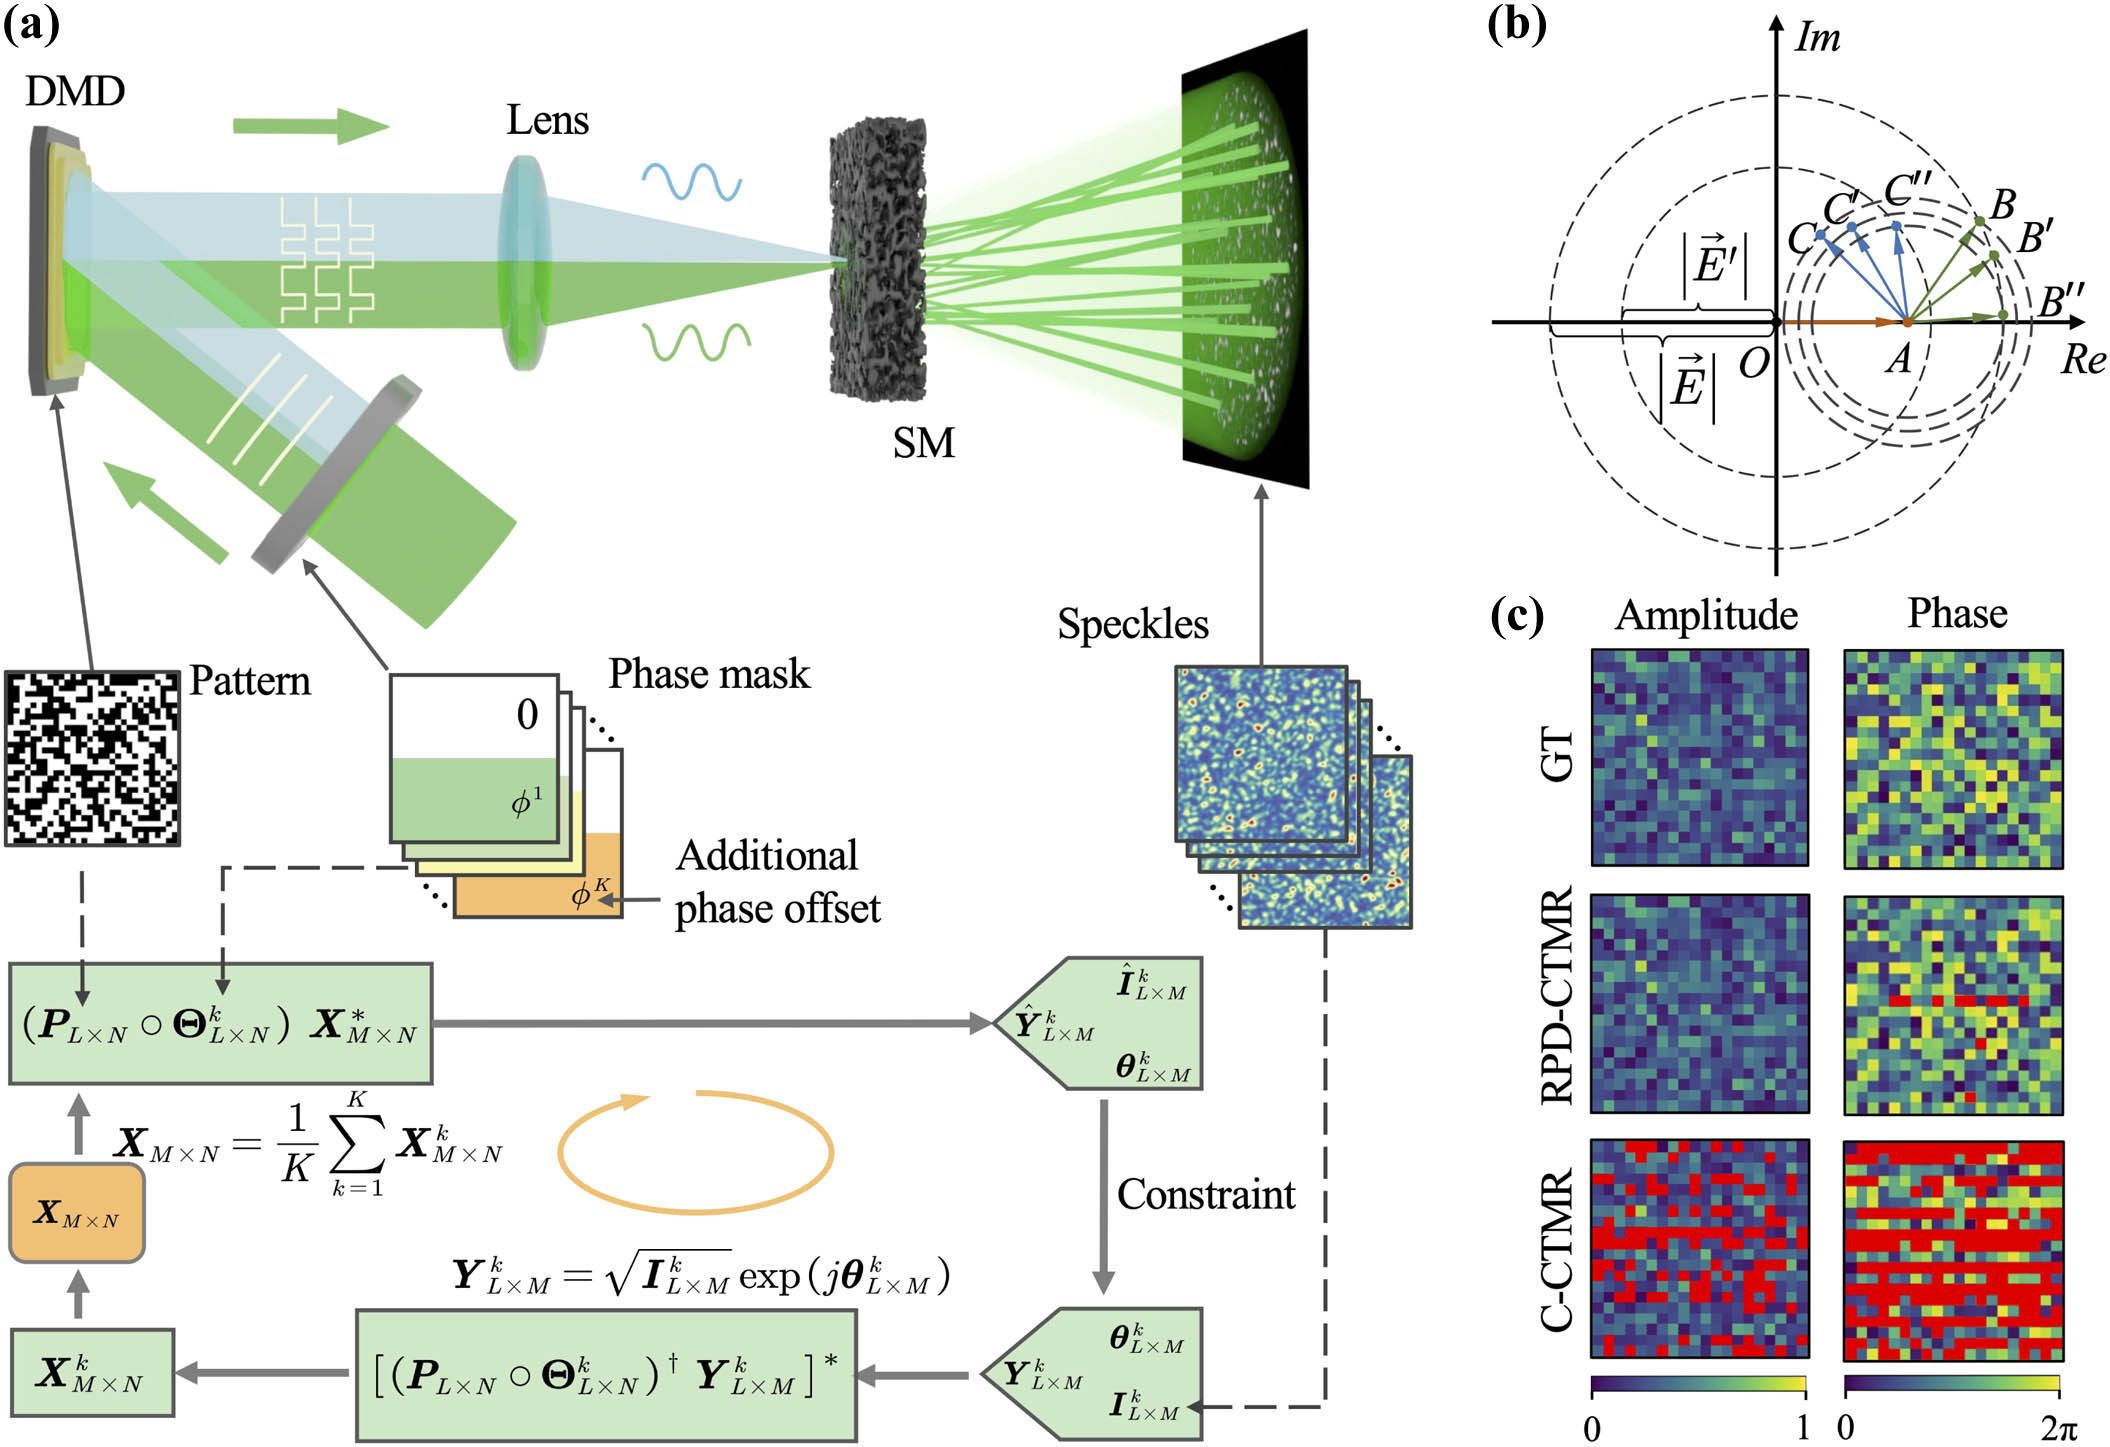
Fig. 1. Principle and schematic of RPD-CTMR. (a) Schematic of RPD-CTMR. (b) Illustration of phase constraint. ∠ B A C = ∠ B ′ A C ′ = ∠ B ′ ′ A C ′ ′ α

Fig. 2. Numerical simulation for comparison between the RPD-CTMR and C-CTMR. (a), (b) NMSE distribution of 1024 rows of X α | | ∠ α K ϕ 0 = ϕ k + 1 − ϕ k
Fig. 3. Schematic and characterization of the RPD-CTMR system. (a) System setup. HWP, half-wave plate; AS, aperture stop; CAS, customized aperture stop; PBS, polarized beam splitter; BS, non-polarizing beam splitter; OL, objective lens. (b) Comparison between the recorded speckle pattern (denoted as GT) and estimated speckle patterns via RPD-CTMR and C-CTMR at α
Fig. 4. Anti-scattering focusing. (a) Single-spot anti-scattering focusing using X R X C X R X C
Fig. 5. Anti-scattering image transmission. The first column shows the binary images to be transmitted through the SM. The second column shows the speckle patterns recorded by the camera. The two RPD-CTMR columns show the retrieved (left) and later binarized (right) images restored by X R X C


Set citation alerts for the article
Please enter your email address

© Copyright 2018-2021 | Chinese Laser Press. All Rights Reserved 沪ICP备15018463号-20