Author Affiliations
1Department of Physics, College of Liberal Arts and Sciences, National University of Defense Technology, Changsha 410073, China2DTU Fotonik, Technical University of Denmark, Lyngby DK-2800, Denmark3School of Electrical Engineering, Yanshan University, Qinhuangdao 066004, China4e-mail: xjli@nudt.edu.cn5e-mail: xgua@fotonik.dtu.dkshow less
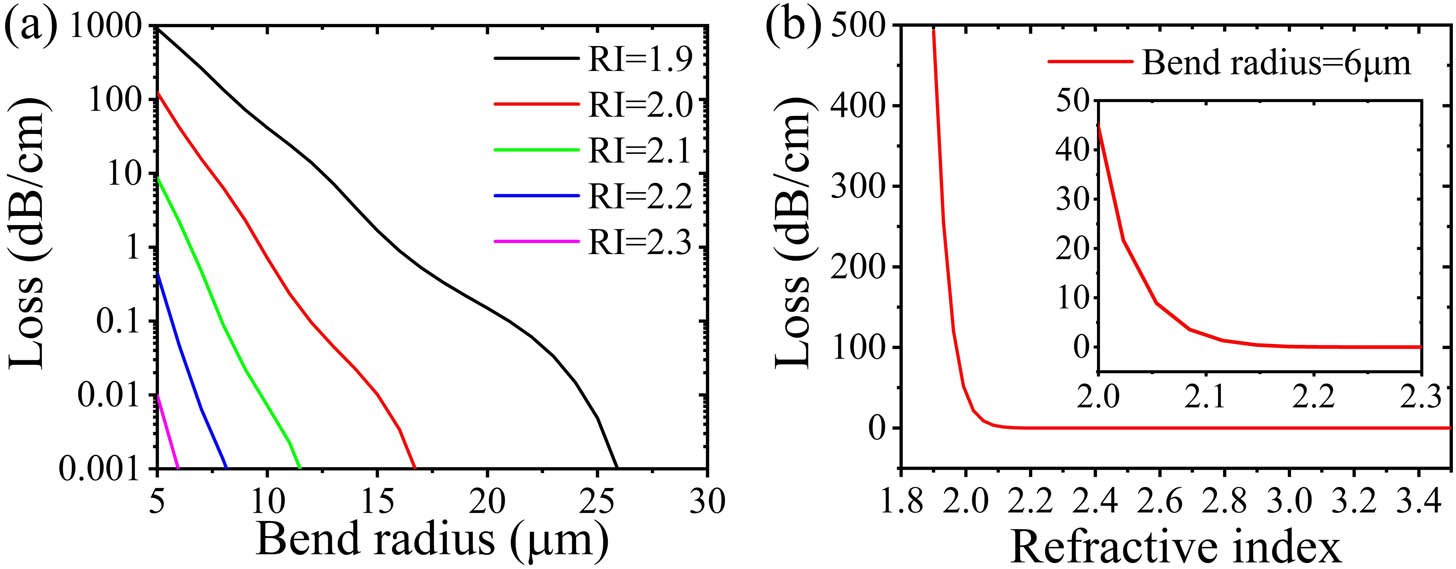
Fig. 1. Calculated bend loss as a function of (a) bend radius and (b) RI of a bend waveguide with a fixed width of 3 μm and height of 460 nm. Inset in (b) is the zoom-in view of the curve. Here, the simulations are carried out at 1550 nm.
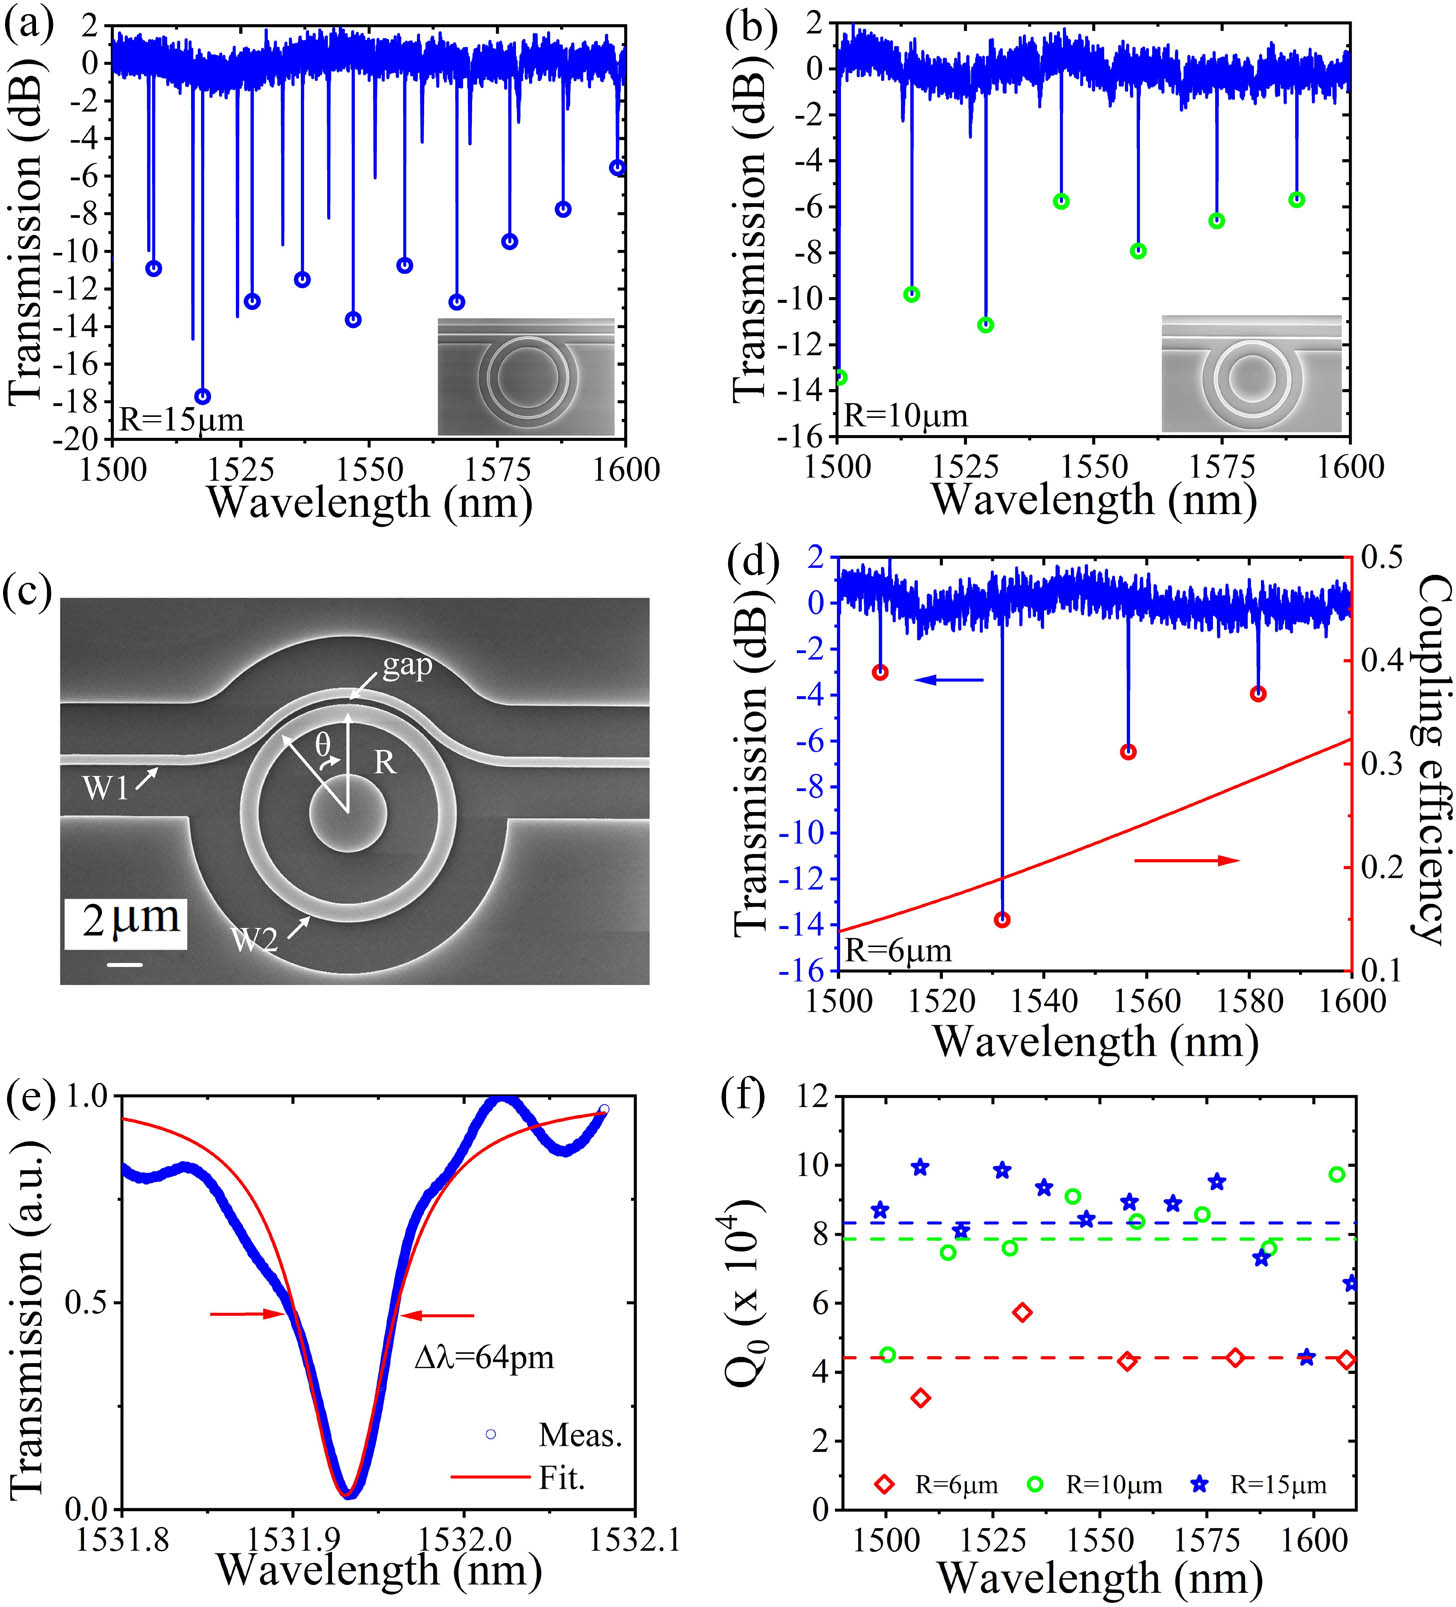
Fig. 2. Linear measurements of the fabricated TiO2 MRRs. Transmission spectra of the MRR with a radius of (a) 15 μm and (b) 10 μm. Insets are the SEM images of these MRRs. (c) SEM image and (d) transmission spectrum of the MRR with a radius of 6 μm and a pulley-type coupler, of which the coupling efficiency is shown by the red line in (d). Circles in (a), (b), and (d) indicate the resonance positions of TE0 mode. (e) Transmission spectrum (blue dot) and Lorentzian fitting curve (red line) of the 6-μm-radius MRR around the resonance of 1531.93 nm. (f) Summary of the extracted Q0 at all the resonances of the three MRRs with dashed lines indicating the average Q0 values.
Fig. 3. (a) Linear losses, (b) attainable power enhancement factors FE2, and (c) Purcell factors (Fp) for the TiO2 MRRs at different radii based on the measurements and fittings.
Fig. 4. Schematic of the experimental setup for the FWM experiments in the fabricated ultra-compact TiO2 MRRs.
Fig. 5. Output FWM spectra of the ultra-compact TiO2 MRRs with radii of (a) R=6 μm under an input pump power of 13 dBm and (b) R=10 μm under an input pump power of 16 dBm. Red and blue lines show the spectra for lights being on resonance and off resonance, respectively. (c) Measured CEs as a function of the input pump power.
Fig. 6. (a) Calculated dispersions of straight and bend TiO2 waveguides with a width of 1170 nm and a height of 460 nm, and inset is the zoom-in picture of the dispersion line corresponding to R=10 μm. (b) Measured output FWM spectra for the fabricated 10-μm-radius TiO2 MRR when lights are on-resonance or off-resonance.
Materials | | () | (eV) | (μm) |
---|
Si [9,10] | 3.45 | | 1.12 | 1.1–6.6 | SiNx [11,12] | 2 | | 5.3 | 0.4–4.5 | [13,14] | 1.44 | | 7.6 | 0.2–2.5 | [14] | 2.05 | | 3.8 | 0.3–8.0 | [15,16] | 2.31 | | 3.1 | 0.4–10 |
|
Table 1. Properties of Si-Based CMOS-Compatible Dielectricsa
MRR | (μm) | | | |
---|
Plasmonic WG [18] | 0.5 | | Limited | | Si [19] | 1.5 | 9000 | Limited | a | Thick [40] | 115 | | b | c | Thin [28] | 1590 | | d | 9 at max | [41] | 50 | | e | f | [42] | 150 | | g | — | [29]h | 136.37 | | 15 | 6.5 | [43]I | 16.37 | | 100 | 45 | This work | 10 | | 122 | 59 | 6 | | 113 | 56 |
|
Table 2. Comparison of MRRs on Different Material Platforms