• Journal of Semiconductors
  • Vol. 42, Issue 12, 122801 (2021)
Fowziya Shaik Ali1, Faisal Al Marzouqi2, A. Afroos Banu1, M. Ismail Fathima3, A. R. Mohamed Jahangir4, K. Mohamed Rafi5, and A. Ayeshamariam6
Author Affiliations
  • 1Department of Chemistry, Khadir Mohideen College, Adirampattinam 614701 (Affiliated to Bharathidasan University, Tiruchirappalli), India
  • 2Department of Process Engineering, International Maritime College Oman, Falaj Al Qabail, Suhar, Oman
  • 3Department of Physics, Arul Anandar College (Auto), Karumathur, Madurai 625514, India
  • 4Biyaq Oilfield Services LLC, Mina Al Fahal PC, 116, Muscat, Sultanate of Oman
  • 5Research Department of Botany, Jamal Mohamed College (Auto) (Affiliated to Bharathidasan University, Thiruchirappalli) – 620020, India
  • 6Research Department of Physics, Khadir Mohideen College (Affiliated to Bharathidasan University, Thiruchirappalli) Adirampattinam – 614701, India
  • show less
    DOI: 10.1088/1674-4926/42/12/122801 Cite this Article
    Fowziya Shaik Ali, Faisal Al Marzouqi, A. Afroos Banu, M. Ismail Fathima, A. R. Mohamed Jahangir, K. Mohamed Rafi, A. Ayeshamariam. Novel synthesis of cerium oxide nano photocatalyst by a hydrothermal method[J]. Journal of Semiconductors, 2021, 42(12): 122801 Copy Citation Text show less
    (Color online) XRD patterns of the CeO2 nano particles synthesized at different molar ratio.
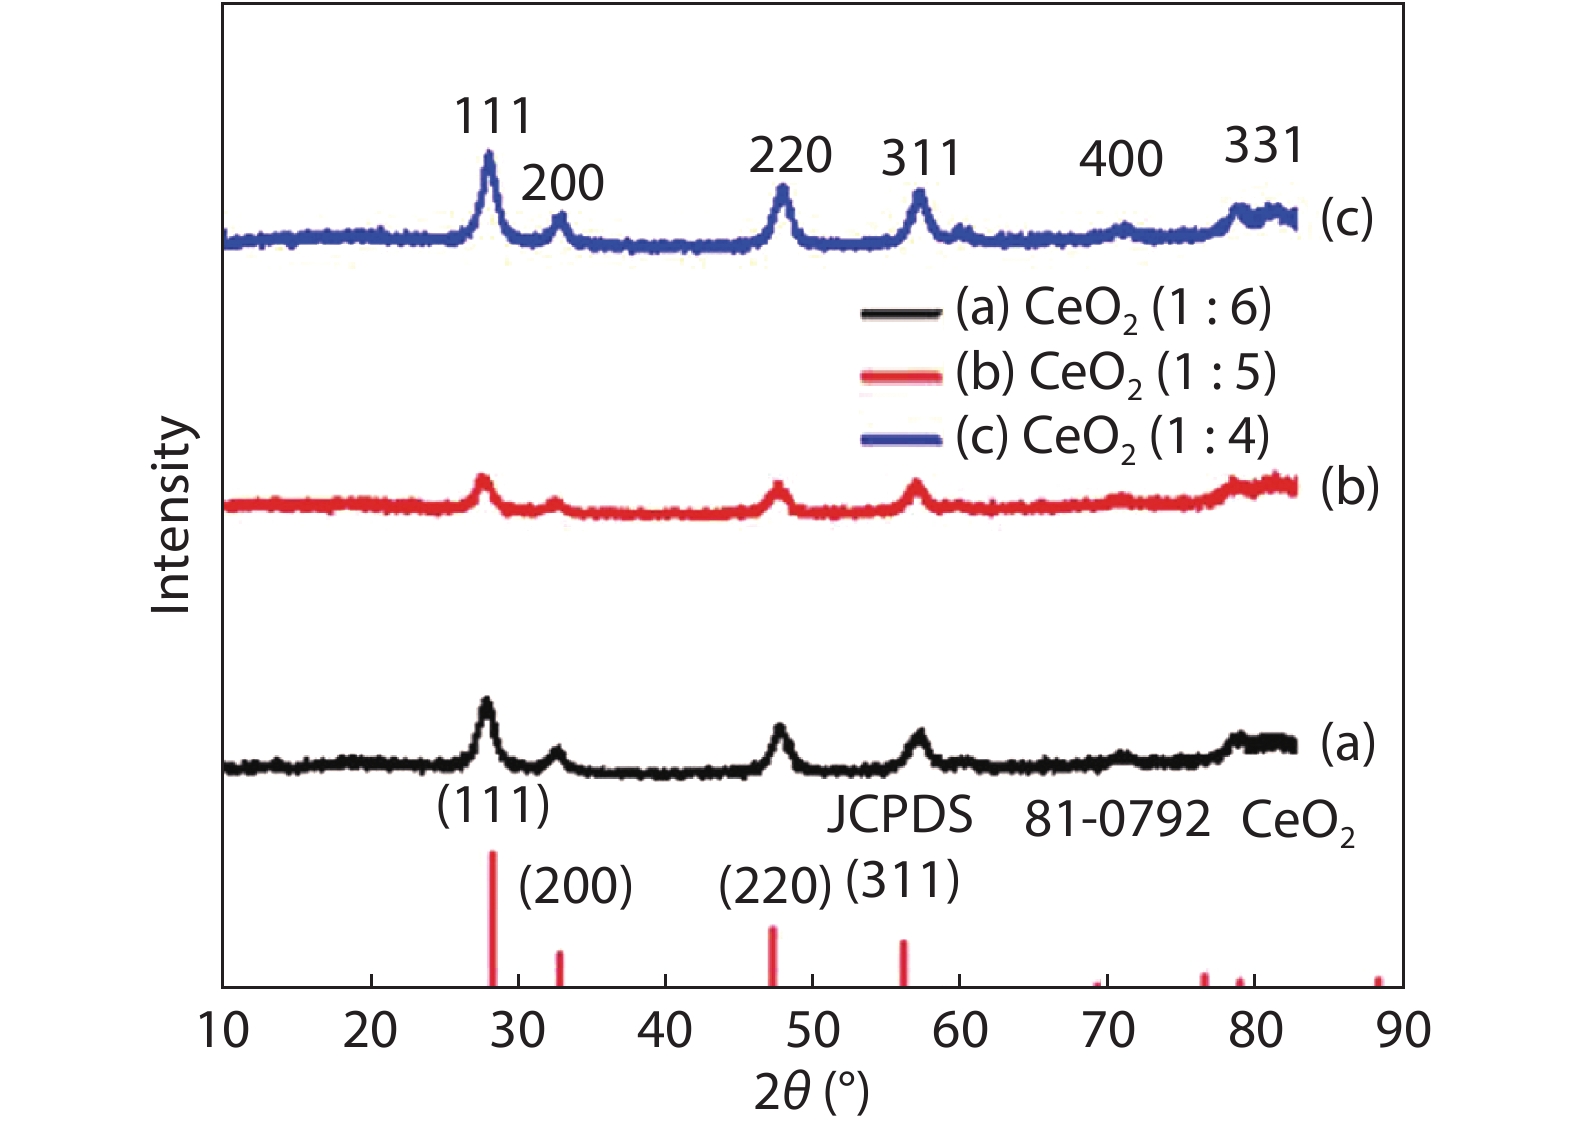
    Fig. 1. (Color online) XRD patterns of the CeO2 nano particles synthesized at different molar ratio.
    SEM image of (a) CeO2 (1 : 6), (b) (1 : 5), (c) (1 : 4).
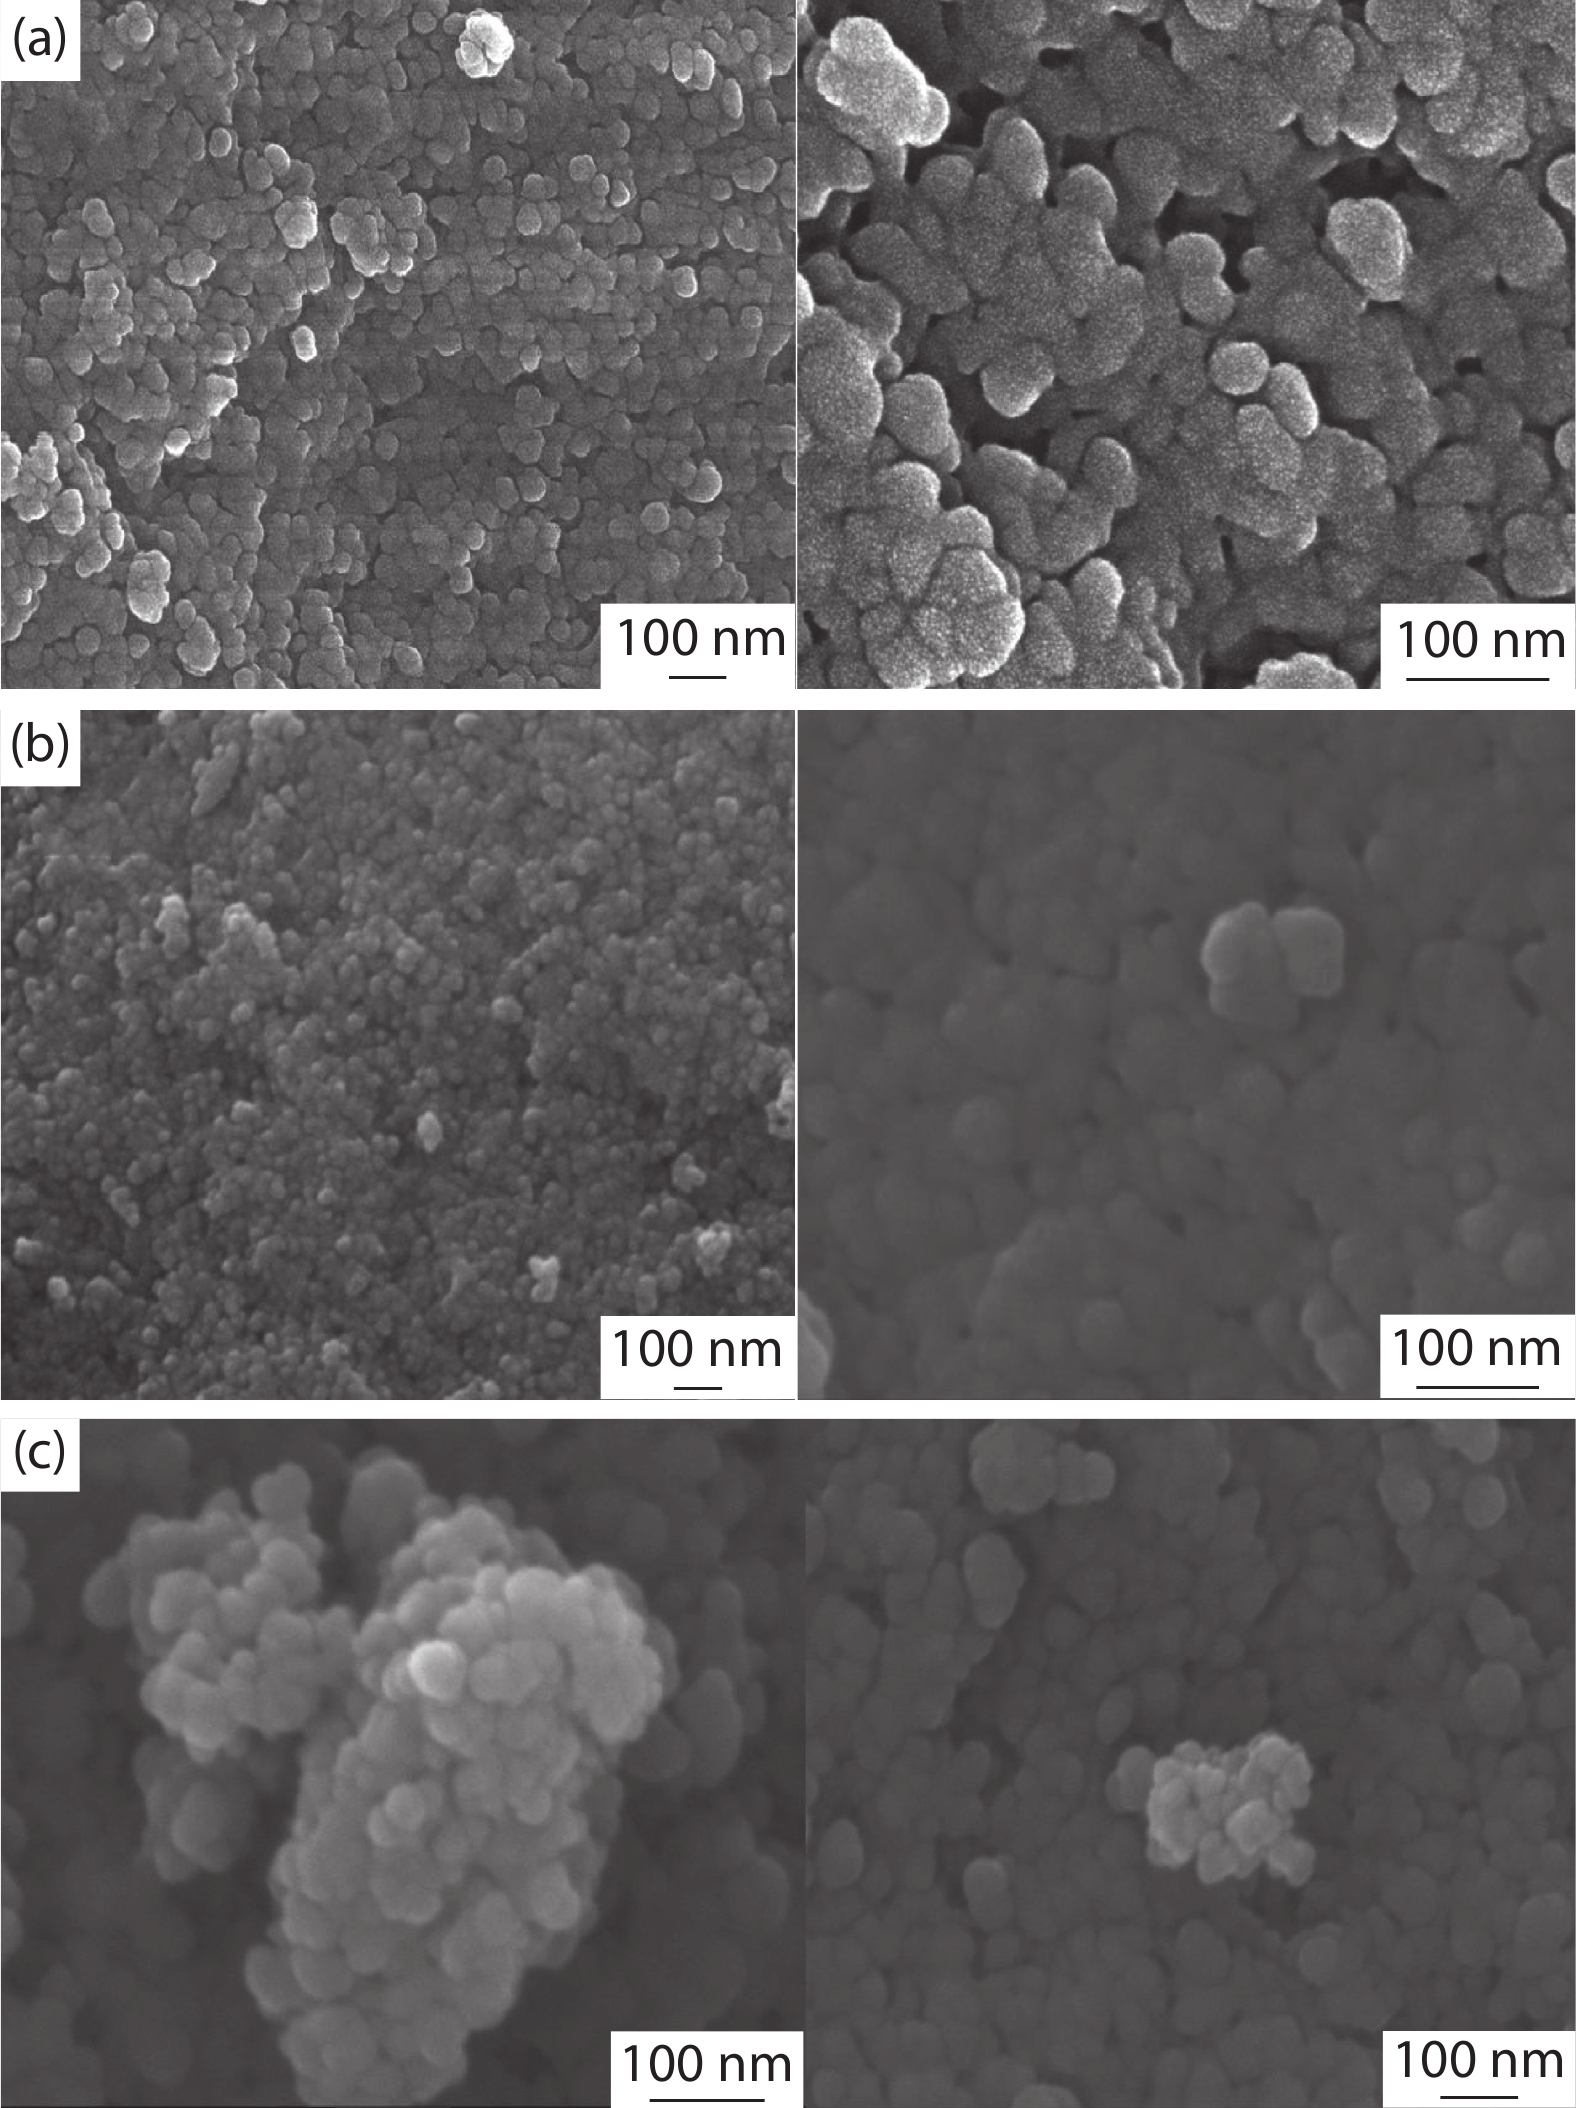
    Fig. 2. SEM image of (a) CeO2 (1 : 6), (b) (1 : 5), (c) (1 : 4).
    (Color online) EDAX spectrum of (a) CeO2 (1 : 6), (b) CeO2 (1 : 5) and (c) CeO2 (1 : 4).
    Fig. 3. (Color online) EDAX spectrum of (a) CeO2 (1 : 6), (b) CeO2 (1 : 5) and (c) CeO2 (1 : 4).
    (Color online) UV–vis absorbance spectra of as synthesised CeO2.
    Fig. 4. (Color online) UV–vis absorbance spectra of as synthesised CeO2.
    UV–vis DRS of (a) ceria (1 : 6), (b) (1 : 5) and (c) (1 : 4) proportions of the samples.
    Fig. 5. UV–vis DRS of (a) ceria (1 : 6), (b) (1 : 5) and (c) (1 : 4) proportions of the samples.
    X-Ray Photoelectron Spectra of ceria nanoparticles.
    Fig. 6. X-Ray Photoelectron Spectra of ceria nanoparticles.
    (Color online) Raman spectra of synthesised ceria nanoparticles in different molar ratio.
    Fig. 7. (Color online) Raman spectra of synthesised ceria nanoparticles in different molar ratio.
    (Color online) Mechanism of Photocatalytic degradation of MB dye.
    Fig. 8. (Color online) Mechanism of Photocatalytic degradation of MB dye.
    (Color online) Photocatalytic degradation of absorbance spectrum of MB in the presence of CeO2 (1 : 4, 1 : 5, 1 : 6 molar ratio). (catalyst dosage – 250 mg/250 mL, concentration of MB = 5 mg/L; light source = UV-B)
    Fig. 9. (Color online) Photocatalytic degradation of absorbance spectrum of MB in the presence of CeO2 (1 : 4, 1 : 5, 1 : 6 molar ratio). (catalyst dosage – 250 mg/250 mL, concentration of MB = 5 mg/L; light source = UV-B)
    (Color online) Variation of normalized concentration of MB (C0 = 5 mg/L) with irradiation time under UV–light condition.
    Fig. 10. (Color online) Variation of normalized concentration of MB (C0 = 5 mg/L) with irradiation time under UV–light condition.
    SampleCrystal size (nm)Lattice parameter (Å)
    CeO2 (1 : 6) 8.25.5262Std-JCPDS 81-0792
    CeO2 (1 : 5) 6.25.5425
    CeO2 (1 : 4) 6.05.54825.412
    Table 1. Crystal structure values of cerium oxide nanoparticles of different molar ratio.
    Fowziya Shaik Ali, Faisal Al Marzouqi, A. Afroos Banu, M. Ismail Fathima, A. R. Mohamed Jahangir, K. Mohamed Rafi, A. Ayeshamariam. Novel synthesis of cerium oxide nano photocatalyst by a hydrothermal method[J]. Journal of Semiconductors, 2021, 42(12): 122801
    Download Citation