
Fowziya Shaik Ali, Faisal Al Marzouqi, A. Afroos Banu, M. Ismail Fathima, A. R. Mohamed Jahangir, K. Mohamed Rafi, A. Ayeshamariam. Novel synthesis of cerium oxide nano photocatalyst by a hydrothermal method[J]. Journal of Semiconductors, 2021, 42(12): 122801
- Journal of Semiconductors
- Vol. 42, Issue 12, 122801 (2021)
Abstract
1. Introduction
One-dimensional oxide material and its nano structure have attracted great attention because of their remarkable applications in many fields of opto-electronic and electrochemical devices[
Various controlled synthetic agents were already reported and indicate that various formation process of CeO2 nano structure and it involves nucleation and aggregation of different sizes of this oxide nano structure[
CeO2 and its doped nano structure have attracted much attention due to improvement in redox properties, transport properties and the surface-to-volume ratios with respect to bulk material[
The active molecules were prepared by various chemical routes. In recent years, along with, the application of nanoscience using various metals such as magnesium oxide (MgO), nanosilicon (Si), silver oxide (Ag2O), zinc oxide (ZnO), copper oxide (CuO), gold (Au), titanium dioxide (TiO2) and calcium oxide (CaO) were studied[
Qi et al. synthesized a series of fullerene (C60)-modified anatase TiO2 (a-TiO2) nanocomposites by an effortless solution phase method and also investigated photocatalytic degradation of methylene blue (MB) under UV-A light irradiation[
Recently, ceria nanoparticles were synthesised by various methods such as combustion[
The successful preparation method of nanoparticles consolidates its atmosphere that small particles condense from the vapour and then filled with oxygen which promotes rapid oxidation of oxide nanoparticles. It has strong particles which has agglomeration during the oxidation step and difficulty on controlling the concentration of the precursor, although its different morphological nano structure such as nano rods, nano wire, and nano cube has already been reported and synthesized by various methods[
This work describes hydrothermal synthesis which is an attractive method for the preparation of crystalline cerium (IV) oxide nanoparticles. It has a simple crystal structure and it has good solid solubility and many dopants[
Many researchers focus on the selection of active components and the role of rare-earth oxides as catalysts. However, there is little research on the effects of pore structure, particle size, crystal surface area and other adsorption mechanisms on the performance of catalysts and the structure–activity relationship. Such improvement mechanisms could be due to the improved light absorption in the visible-light region induced by localized surface plasmon resonance (LSPR) and the efficient interfacial separation and transport of charge carriers in Ag/Ag2S/Bi2MoO6[
2. Experimental methodology
2.1. Materials requirement
Cerium oxide NPs were synthesized using analytical-grade cerium (III) nitrate (Ce(NO3)3·6H2O, Sigma Aldrich, 99%) and sodium hydroxide (NaOH, Sigma Aldrich, 99%) without further purification and ultra-pure water.
The use of hydrothermal synthesis reduced the number of intermediate products. The technique of ceria synthesis has a significant impact on CeO2's photocatalytic activity. In the photocatalytic process carried out under visible and solar light, a rise in the specific surface area, a decrease in the pore size, and an increase in the quantity of oxygen vacancies resulted in a high rate of hydrogen generation.
2.2. Synthesis
Analytical grade cerium nitrate hexa hydrate (Ce(NO)3·6H2O) source material was dissolved in 75 mL of ultra-pure water (1 mmol solution of 0.4342 g was added), and the solution was stirred at room temperature for 15 min. 0.24, 0.20 and 0.16 g of NaOH pellets dissolved in ultra-pure water while the drop wise addition of NaOH solution with continuous stirring (stirring was about 30 min) been made. After 30 min, white precipitant was obtained and the pH noted was 12.8 ue to the dissolved oxygen present in air changes Ce(III) to Ce(IV)[
2.3. Characterization
The crystalline properties of the synthesized nanoparticles were studied by XRD using a Bench X MiniFlex600 equipped with graphite monochromatized Cu Kα radiation (λ = 1.540 Å).
An accelerating voltage of 40 kV and emission current of 30 mA were adopted for the measurements. In addition to XRD, Raman spectroscopy measurements were also performed to confirm the structure of the nanoparticles. The dispersive Raman spectrometer (Bruker SENTERA 200LX model) employs a solid-state laser with an excitation wavelength of 532 nm. Typical Raman measurements were carried out in the spectral range between wave number 200 and 1100 cm–1. The morphology of the crystal was characterized by a field emission scanning electron microscope (FESEM). The FESEM measurements were performed by a JSM-7800F (JOEL, JAPAN). The maximum working voltage of 15 kV and 10 mm working distance was used during the measurement. The FESEM equipment was also furnished with an EDX spectrometer that was used for elemental analysis. X-ray photoelectron spectroscopy (XPS) measurements carried on a multi-probe X-ray photoelectron spectroscopy (XPS) (Omicron Nanotechnology, Germany). XPS measurements were analysed as individual components using Casa XPS software (Casa Software Ltd). The binding energies of the obtained data were calibrated with respect to carbon C 1s peak at 284.6 eV. Absorption spectra of the samples in the diffused reflectance spectrum (UV–vis DRS) mode were recorded in the wavelength range of 200-1000 nm using a spectrophotometer (Lambda 650S- perk Elmer). From the adsorption edge, the band gap values were calculated by extrapolation.
2.4. Photocatalytic activity
Photocatalytic activity of pure CeO2 nano particle were examined by the rate of degradation of MB under the effect of UV-B irradiation. All photocatalytic reactions were performed out in a photocatalytic reactor system, which consists of a cylindrical borosilicate glass reactor vessel with volume of 250 mL, a cooling water jacket, and a UV-B lamp (8 watts medium pressure mercury lamp, Institute of Electric Light Source, Beijing) positioned axially at the centre as a visible light. The reaction temperature was kept at 25 °C by circulating the cooling water. A special glass frit as an air diffuser was fitted at the reactor to uniformly spread the air into the solution. The reaction suspension was prepared freshly for each cycle by mixing 250 mg of catalyst with 250 mL of methylene blue at a starting concentration of 5 mg/L. After the degradation reaction, filtration was done for all samples using a syringe and syringe filter 0.45 µm to remove any precipitated particles. The filtrate was analysed by an UV–vis spectrometer (UC-2450-SHIMADZU). The MB’s maximum characteristic absorption wavelength was positioned[
3. Results and discussion
3.1. X-ray diffraction analysis
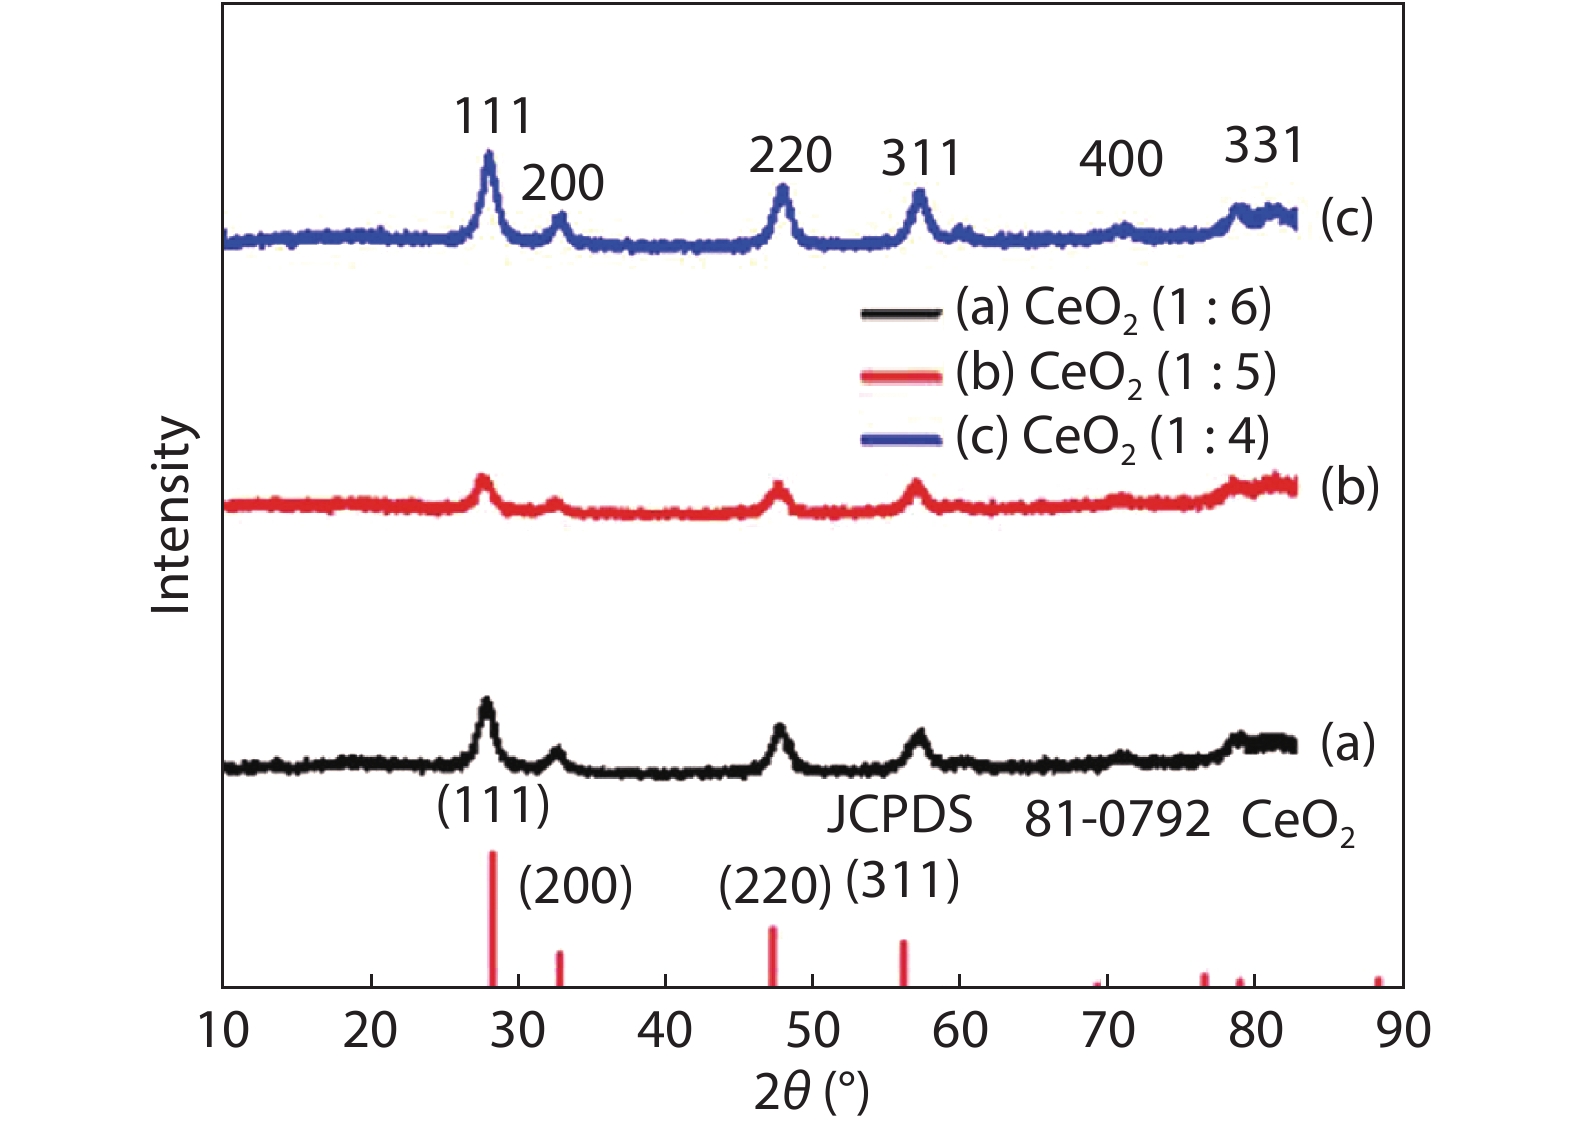
The synthesized CeO2 NPs was characterized by using X-ray diffractometer to study the structural properties of the sample. The XRD patterns of as synthesized sample was shown in Fig. 1. By using JCPDS file no: 81-0792, it was in good agreement with results and its diffractions are equal to (111), (200), (220), (400) and (311) planes. The diffraction peak absorbed in Fig. 1 can be indexed to pure cubic CeO2 and its lattice parameter is a = 5.5425 Å. By using Debye Scherrer’s formula, the average grain size was calculated[
![]()
Figure 1.(Color online) XRD patterns of the CeO2 nano particles synthesized at different molar ratio.
where D is the average grain size, α is a geometric factor (here, α = 0.9), λ is the wavelength of X-rays used for the measurements (λ = 1.54056 Å), β is the FWHM of the diffraction peaks, which can be measured from the XRD peaks and θ is the diffraction angle.
Table 1 displayed the crystalline structure and lattice parameters of CeO2 NPs from XRD results. From Eq. (4) the calculated grain size are 8.2, 6.2 and 6.6 nm for different molar ratio (1 : 6), (1 : 5), (1 : 4) of NaOH respectively. The crystal size was reduced to 6.2 nm by lowering the sodium hydroxide concentration, but when the concentration is lowered higher, the crystal size gradually increases, it shows that 5 mmol concentration of NaOH is suitable to get the optimized crystal size of nano particles. The optimized concentration of NaOH acts as the oxidizing agent to get Ce (IV) oxide, which was confirmed by JCPDS file no: 81-0792 and elemental X-ray analysis.
3.2. SEM with EDXs analysis
The morphological studies of as synthesized CeO2 NPs sample and the nano structures of the sample were examined by SEM shown in Fig. 2.
![]()
Figure 2.SEM image of (a) CeO2 (1 : 6), (b) (1 : 5), (c) (1 : 4).
The mechanism of CeO2 nano particles gives poly crystalline pore evaluation with crystal size ranges from 8.2 to 6.6 nm for different concentrations of NaOH solution. Figs. 2(a) and 2(c) show the uniform and large grain size with a sphere-like structure in the (1 : 6) and (1 : 4) concentration. It can be seen that there is some agglomeration due to strong attractive force among the particles, which develops thicker and longer nano particles that increases the size[
As seen in Fig. 3, the EDAX analysis showed the peaks of the elements and percentages of cerium and oxygen concentrations for the different concentrations of NaOH. There was no such a difference in the elemental analysis and its proportions, which helps in determining the stoichiometry elements in CeO2 NPs. The information ensured that the cerium oxide formed by hydrothermal synthesis was CeO2 nanoparticles.
![]()
Figure 3.(Color online) EDAX spectrum of (a) CeO2 (1 : 6), (b) CeO2 (1 : 5) and (c) CeO2 (1 : 4).
3.3. UV–vis-diffuse reflectance spectra
Optical properties of the synthesized CeO2 NPs studied by using UV–vis DRS. Fig. 4 shows the absorbance spectrum of synthesized CeO2 NPs 200–800 nm wavelength range. The absorption edges of the CeO2 nano cube were found near 440–443 nm range and a strong red shift is shown by the spectra.
![]()
Figure 4.(Color online) UV–vis absorbance spectra of as synthesised CeO2.
The optical absorption near band gap energy Eg was calculated by using Tauc’s formula is[
where α is the absorption coefficient, hν is the incident photon energy, A is the constant.
For direct transition, the plots of (
![]()
Figure 5.UV–vis DRS of (a) ceria (1 : 6), (b) (1 : 5) and (c) (1 : 4) proportions of the samples.
Figs. 5(a)–5(c) depicted that the incorporated oxygen has improper light absorption of capacity of synthesized ceria nano particles. Stronger absorption lies in the region of 200 to 450 nm and the higher absorption of this region clearly states that ceria nano particle has a lower dye loading ability; its photocatalytic activity conforms with this improvement in light absorption of capacity in our second sample, which is excellent, and is mainly due to the incorporation of oxygen inside the sites[
3.4. XPS analysis
The composition and purity of the as-prepared ceria sample were studied by XPS analysis as shown in Fig. 6. Peaks of Ce 3d, O 1s, C 1s, and Ce 4d can be analysed using CASAXPS software. There were no peaks obtained for Na 2p, which indicate that there were no impurities of NaOH. XPS analysis also confirmed that as-synthesized nano particle contains Ce4+ ion and oxygen vacancies, which is shown in the normal mode of Fig. 6(a). However, the following figure specifically defined the binding energy peaks, which were consistent with previously published findings labeled in our Fig. 6(b) – the final state of Ce4+[
![]()
Figure 6.X-Ray Photoelectron Spectra of ceria nanoparticles.
3.5. Raman spectroscopy
Fig. 7 exhibits that the Ce(IV) ion and oxygen vacancy contribute to the most intense peak around 466 cm–1 of the Raman peak position because there is no weaker peaks where detected for this CeO2 nanoparticles. It can be attributed there is no ascribed broad band spectrum due to oxygen vacancy and defects caused by CeO2 nanoparticles. The peak at 466 cm–1 is assigned to first-order Raman mode (F2g) features of super oxides, which is already reported in the literature[
![]()
Figure 7.(Color online) Raman spectra of synthesised ceria nanoparticles in different molar ratio.
Among the three samples, the concentration of oxygen vacancy is bigger than the higher concentration of Ce(IV) ion, which is well matched with spherical formula detected for the second sample. So, we can conclude that even the energy band is nearly 2.5 eV and red shift results of Ce(IV) ion and oxygen vacancy lead to a decrease in the binding of nanoparticles, which is the main reason of hydrothermal synthesis and its reaction time of 12 h. It is believed that there is no degree of oxygen defect for these three samples and it confirms that the increase in reaction time from 6 to 12 h enhances the above said properties of CeO2 nanoparticles[
3.6. Photocatalytic degradation study
In order to investigate the photo catalytic degradation properties of as-prepared CeO2 nano structured samples, MB was used as model pollutants to study the photo catalytic performance of CeO2 NPs. The utmost absorptive energy of methylene blue was at 664 nm. Fig. 8 shows the schematic illustration of the possible photocatalytic reaction mechanism over CeO2 NPs. The absorptive intensity of MB gradually decreases with the prolonging of the irradiation time when the mixed solution of MB and CeO2 nanoparticles were exposed to UV-B light irradiation at room temperature. This result indicates that MB dye attains optimum degradation behaviour under the catalysis of CeO2 nanoparticles.
![]()
Figure 8.(Color online) Mechanism of Photocatalytic degradation of MB dye.
More importantly, the CeO2 (1 : 4, 1 : 5, 1 : 6 molar ratio of NaOH) nanoparticles dramatically enlarged the specific surface area calculated by BET analysis to 488, 492 and 490 m2/g, together with an increase in micropore volume from 0.010, 0.310 and 0.206 cm3/g, which is, in fact, much higher than the reported semiconductor-graphene composites or most of the porous photocatalysts[
The improved photocatalytic activity of CeO2 (1 : 4, 1 : 5, 1 : 6 molar ratio of NaOH) nanoparticles under UV irradiation is attributed to high-surface-area, enhanced absorption of MB dyes, and more efficient separation of photogenerated electron–hole pairs. The transfer of photogenerated electrons from the surface of the samples reduces the possibility of decomposing Ce4+ for the recycling of CeO2 photocatalyst[
Figs. 9(a)–9(c). Photocatalytic degradation of absorbance spectrum of MB in the presence of CeO2 (1 : 4, 1 : 5, 1 : 6 molar ratio), (catalyst dosage – 250 mg/250 mL, concentration of MB = 5 mg/L; light source = UV-B). The photo-catalyst produces surface oxidation to eliminate the colour effect of MB dye such as organic compounds when it is exposed to UV light. By applying the principle of degradation, dissolving
![]()
Figure 9.(Color online) Photocatalytic degradation of absorbance spectrum of MB in the presence of CeO2 (1 : 4, 1 : 5, 1 : 6 molar ratio). (catalyst dosage – 250 mg/250 mL, concentration of MB = 5 mg/L; light source = UV-B)
In order to transfer electrons from the valence band (VB) to the conduction band (CB) in CeO2, the energy of light photons should be at least equal or higher than the energy of a band gap in the photocatalyst. CeO2 has some energy (2.88 eV = 3.2 × 1.6 × 10–19 J) for (1 : 6) ratio, the necessary wavelength is nearly 430 nm, which tells us that the UV light needed this much of amount of energy to activate the photo catalyst for the degradation[
CeO2 nanoparticles as photocatalysis effectively detoxify noxious organic pollutants. UV is used to create electron–hole pairs in the semiconducting oxide of CeO2 NPs.
Electrons can react with oxygen adsorbed on the photocatalyst surface and then the formation of superoxide anion radicals is observed according to the following reaction:
The radical species then attack the organic molecule, which is eventually oxidized to CO2, H2O, and HCl if the organic molecule contains chlorine[
One of the most critical controlling elements in the generation of reactive oxide species is the location of edges in CB and VB (ROS). Because the locations of CB and VB in CeO2 include the possibility for the generation of hydroxyl radicals and superoxide anion radicals (Fig. 8). The major reactive oxygen species (ROS) produced in the photocatalytic system in water oxidation by photogenerated holes (h+) and oxygen reduction by photoexcited electrons (e) in CB are hydroxyl radicals (OH•) and superoxide anion radicals (O2•). These species, like hydroperoxide radicals (HO2•), are extremely reactive and can contribute to the photocatalytic degradation of contaminants in industrial effluent[
![]()
Figure 10.(Color online) Variation of normalized concentration of MB (
Under light irradiation, the dyes are excited and then photo-generated electrons could easily transfer into the CeO2 surface and effectively participated in the redox reaction of CeO2 nanoparticles. Fig. 10 shows the variation of normalized concentration of MB (C0 = 5 mg/L) with irradiation time under UV–light condition. This figure revealed the effect of absorptivity and photo reactivity resulting in an appreciable improvement in the photo degradation of MB with CeO2 nanoparticles. Here CeO2 nanoparticles served as an electron acceptor and conductor due to its one-dimensional structure, which helps or suppress charge recombination, enhancing charge separation efficiency and improving photo catalytic activities. The excellent electron factors can enhance the photo catalytic activity of nano-sized CeO2, high dye adsorptivity and high electron conduction to remove the dye molecules by the process of photo degradation.
When the particle size of CeO2 is decreased to a nanoscale and applied in the form of nanostructures, the characteristics of the material can be drastically altered. CeO2 features such as lattice symmetry, cell parameters, and structural features are all affected by this process. In their bulk form, phases have a high surface energy and are unstable. The surface energy of nanostructured CeO2 materials dramatically reduces as the particle size is decreased to the nanoscale, and nanostructured materials have a high level of stability[
4. Conclusion
CeO2 NPs were successfully synthesized using an efficient hydrothermal process with three different NaOH precipitating agent molar ratios. Depending on the reaction time and NaOH concentration, CeO2 NPs had different crystal sizes and lattice parameters. Under MB, the prepared CeO2 NPs' photodegradation activity was characterized and evaluated. The crystal size was reported to be 8.2, 6.2, and 6.6 nm, with a cubic structure. The band gap values of 2.87, 2.82, and 2.88 eV were measured using a UV–vis spectrometer to describe the optical properties. Its value is lower than the bulk value of CeO2. In the (1 : 6) and (1 : 4) molar ratios, these CeO2 NPs are all spherical, with heavy agglomeration. The grain size of the (1 : 5) sample is unique in nature, and its best morphological structure justified that this composition is stronger in terms of Ce(IV) and oxygen ion composition, and XRD tests concluded that it is a single crystalline cubic cerium (IV) oxide nano particle. Oxygen defects decrease as reaction time (6–12 h) increases in two samples (1 : 6) and (1 : 4), respectively. Under UV light irradiation, the photocatalytic degradation behavior of MB dye shows that hydrothermally prepared CeO2 NPs are an efficient photo catalyst.
References
[1] M Mogensen, N M Sammes, G A Tompsett. Physical, chemical and electrochemical properties of pure and doped ceria. Solid State Ion, 129, 63(2000).
[2] M Yashima, S Sasaki, Y Yamaguchi et al. Internal distortion in ZrO2-CeO2 solid solutions: Neutron and high-resolution synchrotron X-ray diffraction study. Appl Phys Lett, 72, 182(1998).
[3] X Feng, D C Sayle, Z L Wang et al. Converting ceria polyhedral nanoparticles into single-crystal nanospheres. Science, 312, 1504(2006).
[4] K Yamashita. Hydrothermal synthesis and low temperature conduction properties of substituted ceria ceramics. Solid State Ion, 81, 53(1995).
[5] N Imanaka, T Masui, H Hirai et al. Amorphous cerium−titanium solid solution phosphate as a novel family of band gap tunable sunscreen materials. Chem Mater, 15, 2289(2003).
[6] A Kubacka, M Fernández-García, G Colón. Advanced nanoarchitectures for solar photocatalytic applications. Chem Rev, 112, 1555(2012).
[7] J Yu, S Wang, J Low et al. Enhanced photocatalytic performance of direct Z-scheme g-C3N4-TiO2 photocatalysts for the decomposition of formaldehyde in air. Phys Chem Chem Phys, 15, 16883(2013).
[8] C Miranda, H Mansilla, J Yáñez et al. Improved photocatalytic activity of g-C3N4/TiO2 composites prepared by a simple impregnation method. J Photochem Photobiol A, 253, 16(2013).
[9] M J Muñoz-Batista, A Kubacka, M Fernández-García. Effect of g-C3N4 loading on TiO2-based photocatalysts: UV and visible degradation of toluene. Catal Sci Technol, 4, 2006(2014).
[10] L L Murrell, S J Tauster, D R Anderson. Laser Raman characterization of surface phase precious metal oxides formed on CeO2. Stud Surf Sci Catal, 71, 275(1991).
[11] K Hussain, T Hussain. Gold nanoparticles: A boon to drug delivery system. South Ind J Biol Sci, 1, 128(2015).
[12] F S Ali, K Z Qi, B Al Wahaibi et al. Photocatalytic degradation of bisphenol A in the presence of TiO2 nanoparticle: Effect of solvent on size control. Desal Water Treat, 79, 301(2017).
[13] K Z Qi, R Selvaraj, T Al Fahdi et al. Enhanced photocatalytic activity of anatase-TiO2 nanoparticles by fullerene modification: A theoretical and experimental study. Appl Surf Sci, 387, 750(2016).
[14] Y F Zhang, R Selvaraj, M Sillanpää et al. Enhanced solar photocatalytic activity of Er3+:YAlO3-loaded BiPO4 composite. J Ind Eng Chem, 24, 161(2015).
[15] J H Sim, H N Umh, H H Shin et al. Comparison of adsorptive features between silver ion and silver nanoparticles on nanoporous materials. J Ind Eng Chem, 20, 2864(2014).
[16] T Mokkelbost, I Kaus, T Grande et al. Combustion synthesis and characterization of nanocrystalline CeO2-based powders. Chem Mater, 16, 5489(2004).
[17] R Maric, M Oljaca, B Vukasinovic et al. Synthesis of oxide nanopowders in nano spray diffusion flames. Mater Manuf Process, 19, 1143(2004).
[18] E Kockrick, C Schrage, A Grigas et al. Synthesis and catalytic properties of microemulsion-derived cerium oxide nanoparticles. J Solid State Chem, 181, 1614(2008).
[19] L Mädler, W J Stark, S E Pratsinis. Flame-made ceria nanoparticles. J Mater Res, 17, 1356(2002).
[20] C Laberty-Robert, J W Long, E M Lucas et al. Sol–gel-derived ceria nanoarchitectures: Synthesis, characterization, and electrical properties. Chem Mater, 18, 50(2006).
[21] M Y Cho, K C Roh, S M Park et al. Control of particle size and shape of precursors for ceria using ammonium carbonate as a precipitant. Mater Lett, 64, 323(2010).
[22] J J Gulicovski, S K Milonjić, K M Szécsényi. Synthesis and characterization of stable aqueous ceria sols. Mater Manuf Process, 24, 1080(2009).
[23] M Hirano, M Inagaki. Preparation of mono disperse cerium (IV) oxide particles by thermal hydrolysis. J Mater Chem, 10, 473(2000).
[24] R R Cui, W C Lu, L M Zhang et al. Template-free synthesis and self-assembly of CeO2 nanospheres fabricated with foursquare nanoflakes. J Phys Chem C, 113, 21520(2009).
[25] A A Athawale, M S Bapat, P A Desai. Hydroxide directed routes to synthesize nanosized cubic ceria (CeO2). J Alloys Compd, 484, 211(2009).
[26] S K Sahoo, M Mohapatra, A K Singh et al. Hydrothermal synthesis of single crystalline nano CeO2 and its structural, optical, and electronic characterization. Mater Manuf Process, 25, 982(2010).
[27] Y Q Zhai, S Y Zhang, H Pang. Preparation, characterization and photocatalytic activity of CeO2 nanocrystalline using ammonium bicarbonate as precipitant. Mater Lett, 61, 1863(2007).
[28] Y C Zhou, M N Rahaman. Hydrothermal synthesis and sintering of ultrafine CeO2 powders. J Mater Res, 8, 1680(1993).
[29] K Nikolaou. Emissions reduction of high and low polluting new technology vehicles equipped with a CeO2 catalytic system. Sci Total Environ, 235, 71(1999).
[30] E K Goharshadi, S Samiee, P Nancarrow. Fabrication of cerium oxide nanoparticles: Characterization and optical properties. J Colloid Interface Sci, 356, 473(2011).
[31] M M Khan, S A Ansari, D Pradhan et al. Defect-induced band gap narrowed CeO2 nanostructures for visible light activities. Ind Eng Chem Res, 53, 9754(2014).
[32] X G Zheng, S Huang, D M Yang et al. Synthesis of X-architecture CeO2 for the photodegradation of methylene blue under UV-light irradiation. J Alloys Compd, 705, 131(2017).
[33] S J Li, C C Wang, Y P Liu et al. Photocatalytic degradation of antibiotics using a novel Ag/Ag2S/Bi2MoO6 plasmonic p-n heterojunction photocatalyst: Mineralization activity, degradation pathways and boosted charge separation mechanism. Chem Eng J, 415, 128991(2021).
[34] S J Li, J L Chen, S W Hu et al. Facile construction of novel Bi2WO6/Ta3N5 Z-scheme heterojunction nanofibers for efficient degradation of harmful pharmaceutical pollutants. Chem Eng J, 402, 126165(2020).
[35] S J Li, B Xue, J L Chen et al. Constructing a plasmonic p-n heterojunction photocatalyst of 3D Ag/Ag6Si2O7/Bi2MoO6 for efficiently removing broad-spectrum antibiotics. Sep Purif Technol, 254, 117579(2021).
[36] S J Li, S W Hu, W Jiang et al.
[37] B Dong, L Y Li, Z F Dong et al. Fabrication of CeO2 nanorods for enhanced solar photocatalysts. Int J Hydrog Energy, 43, 5275(2018).
[38] L N Wang, F M Meng, K K Li et al. Characterization and optical properties of pole-like nano-CeO2 synthesized by a facile hydrothermal method. Appl Surf Sci, 286, 269(2013).
[39]
[40] M Lin, Z Y Fu, H R Tan et al. Hydrothermal synthesis of CeO2 nanocrystals: Ostwald ripening or oriented attachment. Cryst Growth Des, 12, 3296(2012).
[41] A Jawor-Baczynska, B D Moore, J Sefcik. Effect of mixing, concentration and temperature on the formation of mesostructured solutions and their role in the nucleation of dl-valine crystals. Faraday Discuss, 179, 141(2015).
[42] P G Vekilov. The two-step mechanism of nucleation of crystals in solution. Nanoscale, 2, 2346(2010).
[43]
[44] Z L Wang, Z W Quan, J Lin. Remarkable changes in the optical properties of CeO2 nanocrystals induced by lanthanide ions doping. Inorg Chem, 46, 5237(2007).
[45] X Y Wang, J J Tian, C B Fei et al. Rapid construction of TiO2 aggregates using microwave assisted synthesis and its application for dye-sensitized solar cells. RSC Adv, 5, 8622(2015).
[46] F Lu, F M Meng, L N Wang et al. Morphology-selective synthesis method of nanopolyhedra and square-like CeO2 nanoparticles. Mater Lett, 73, 154(2012).
[47] C R Li, X Q Zhang, W J Dong et al. High photocatalytic activity material based on high-porosity ZnO/CeO2 nanofibers. Mater Lett, 80, 145(2012).
[48] S N Li, H Q Zhu, Z F Qin et al. Catalytic performance of gold supported on mn, Fe and Ni doped ceria in the preferential oxidation of CO in H2-rich stream. Catalysts, 8, 469(2018).
[49] A E C Palmqvist, M Wirde, U Gelius et al. Surfaces of doped nanophase cerium oxide catalysts. Nanostruct Mater, 11, 995(1999).
[50] W H Weber, K C Hass, J R McBride. Raman study of CeO2: Second-order scattering, lattice dynamics, and particle-size effects. Phys Rev B, 48, 178(1993).
[51] X H Lu, X Huang, S L Xie et al. Facile electrochemical synthesis of single crystalline CeO2 octahedrons and their optical properties. Langmuir, 26, 7569(2010).
[52] S L Wang, M Xu, T Y Peng et al. Porous hypercrosslinked polymer-TiO2-graphene composite photocatalysts for visible-light-driven CO2 conversion. Nat Commun, 10, 676(2019).
[53] X F Yang, H Y Cui, Y Li et al. Fabrication of Ag3PO4-graphene composites with highly efficient and stable visible light photocatalytic performance. ACS Catal, 3, 363(2013).
[54] R J Chai, Y K Li, Q F Zhang et al. Monolithic Ni-MO
[55] B Solsona, P Concepción, S Hernández et al. Oxidative dehydrogenation of ethane over NiO-CeO2 mixed oxides catalysts. Catal Today, 180, 51(2012).
[56] Z Q Zhang, L P Han, R J Chai et al. Microstructured CeO2-NiO-Al2O3/Ni-foam catalyst for oxidative dehydrogenation of ethane to ethylene. Catal Commun, 88, 90(2017).
[57] M Kohantorabi, M R Gholami. Kinetic analysis of the reduction of 4-nitrophenol catalyzed by CeO2 nanorods-supported CuNi nanoparticles. Ind Eng Chem Res, 56, 1159(2017).
[58] Y Liang, Z Chen, W Yao et al. Decorating of Ag and CuO on Cu nanoparticles for enhanced high catalytic activity to the degradation of organic pollutants. Langmuir, 33, 7606(2017).
[59] S Park, J Park, R Selvaraj et al. Facile microwave-assisted synthesis of SnS2 nanoparticles for visible-light responsive photocatalyst. J Ind Eng Chem, 31, 269(2015).
[60] A Capodaglio. Contaminants of emerging concern removal by high-energy oxidation-reduction processes: State of the art. Appl Sci, 9, 4562(2019).

Set citation alerts for the article
Please enter your email address
© Copyright 2018-2021 | Chinese Laser Press. All Rights Reserved 沪ICP备15018463号-20