• Acta Optica Sinica
  • Vol. 41, Issue 7, 0703002 (2021)
Fengxiang Ma1, Yu Tian2, Ke Chen3、*, Bo Zhang3, Chenxi Li3, Guangyin Zhang3, Min Guo3, Beilei Yang3, and Yue Zhao1
Author Affiliations
  • 1Electric Power Research Institute of State Grid Anhui Electric Power Co., Ltd., Hefei, Anhui 230601, China
  • 2State Grid Anhui Electric Power Co., Ltd., Hefei, Anhui 230061, China
  • 3School of Optoelectronic Engineering and Instrumentation Science, Dalian University of Technology, Dalian, Liaoning 116024, China
  • show less
    DOI: 10.3788/AOS202141.0703002 Cite this Article Set citation alerts
    Fengxiang Ma, Yu Tian, Ke Chen, Bo Zhang, Chenxi Li, Guangyin Zhang, Min Guo, Beilei Yang, Yue Zhao. Detection Technology of H2S and CO2 Based on Fiber Amplifier Enhanced Photoacoustic Spectroscopy[J]. Acta Optica Sinica, 2021, 41(7): 0703002 Copy Citation Text show less
    Absorption lines of H2S and CO2 in the near-infrared region and the simulated 2f signals. (a) Absorption lines of H2S and CO2 in the near-infrared region; (b) simulated 2f signals of H2S and CO2
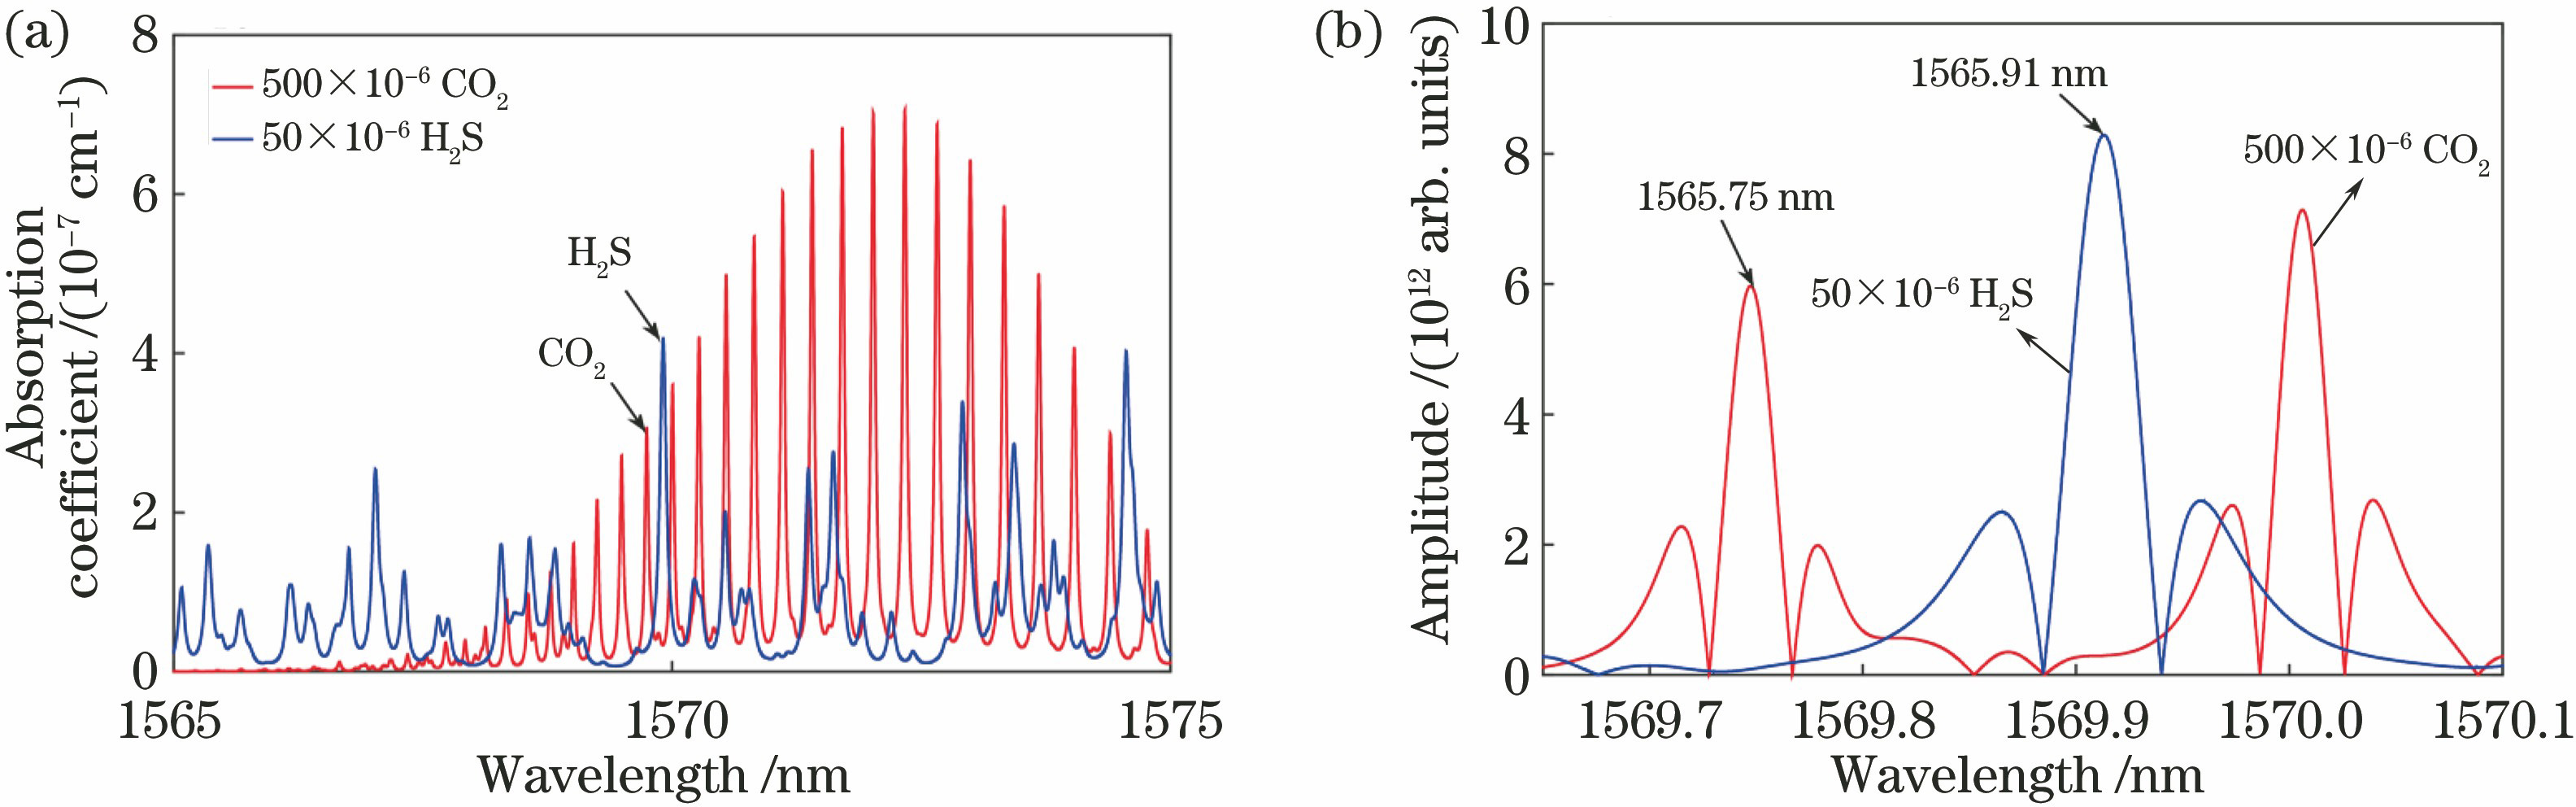
    Fig. 1. Absorption lines of H2S and CO2 in the near-infrared region and the simulated 2f signals. (a) Absorption lines of H2S and CO2 in the near-infrared region; (b) simulated 2f signals of H2S and CO2
    Structure diagram and photo of the fiber amplification enhanced photoacoustic spectroscopy based gas detection system. (a) Structure diagram; (b) photo
    Fig. 2. Structure diagram and photo of the fiber amplification enhanced photoacoustic spectroscopy based gas detection system. (a) Structure diagram; (b) photo
    Relationship between photoacoustic signal amplitude and modulation current. (a) H2S; (b) CO2
    Fig. 3. Relationship between photoacoustic signal amplitude and modulation current. (a) H2S; (b) CO2
    Responses of this system to 2f signals generated by H2S/N2 gas mixtures with different H2S volume fractions. (a) 2f signals generated by H2S/N2 gas mixtures with different H2S volume fractions; (b) peak values of the 2f signals as a function of H2S volume fractions
    Fig. 4. Responses of this system to 2f signals generated by H2S/N2 gas mixtures with different H2S volume fractions. (a) 2f signals generated by H2S/N2 gas mixtures with different H2S volume fractions; (b) peak values of the 2f signals as a function of H2S volume fractions
    Responses of this system to 2f signals generated by CO2/N2 gas mixtures with different CO2 volume fractions. (a) 2f signals generated by CO2/N2 gas mixtures with different CO2 volume fractions; (b) peak values of the 2f signals as a function of CO2 volume fractions
    Fig. 5. Responses of this system to 2f signals generated by CO2/N2 gas mixtures with different CO2 volume fractions. (a) 2f signals generated by CO2/N2 gas mixtures with different CO2 volume fractions; (b) peak values of the 2f signals as a function of CO2 volume fractions
    Interference of CO2 on H2S absorption. (a) Interference absorption spectrum; (b) long-term detection of H2S response and high-concentration CO2 interference
    Fig. 6. Interference of CO2 on H2S absorption. (a) Interference absorption spectrum; (b) long-term detection of H2S response and high-concentration CO2 interference
    Allan analysis results of H2S and CO2. (a) Allan deviation analysis to H2S when the photoacoustic cell is full of air, inset is long term equivalent H2S concentration; (b) Allan deviation analysis to CO2 when the photoacoustic cell is full of air, inset is long term equivalent CO2 concentration
    Fig. 7. Allan analysis results of H2S and CO2. (a) Allan deviation analysis to H2S when the photoacoustic cell is full of air, inset is long term equivalent H2S concentration; (b) Allan deviation analysis to CO2 when the photoacoustic cell is full of air, inset is long term equivalent CO2 concentration
    MeasurementgroupMeasured volumefraction ofCO2 /10-6Measured volumefraction ofH2S /10-6Corrected volumefraction ofH2S /10-6Deviationbeforecorrection /%Deviation aftercorrection /%
    12528.332.625.430.41.6
    22472.433.126.132.44.4
    32488.932.125.128.40.4
    42515.231.424.325.62.8
    52473.632.225.228.80.8
    62532.133.025.832.03.2
    71016.942.639.56.51.3
    81012.343.340.28.30.5
    9979.642.939.97.30.3
    101005.643.640.59.01.3
    11982.343.940.99.82.3
    12994.142.239.25.52.0
    13416.95.84.516.010.0
    14427.36.65.332.06.0
    15465.87.15.742.014.0
    16452.97.35.946.018.0
    17477.35.84.316.014.0
    18433.66.45.128.02.0
    Table 1. Mixed gas measurement and correction results
    Fengxiang Ma, Yu Tian, Ke Chen, Bo Zhang, Chenxi Li, Guangyin Zhang, Min Guo, Beilei Yang, Yue Zhao. Detection Technology of H2S and CO2 Based on Fiber Amplifier Enhanced Photoacoustic Spectroscopy[J]. Acta Optica Sinica, 2021, 41(7): 0703002
    Download Citation