• Photonics Research
  • Vol. 7, Issue 5, 494 (2019)
Zhongjian Xie1、†, Feng Zhang1、†, Zhiming Liang1、†, Taojian Fan1, Zhongjun Li2, Xiantao Jiang1、3、5, Hong Chen4、6, Jianqing Li2, and Han Zhang1、*
Author Affiliations
  • 1Shenzhen Engineering Laboratory of Phosphorene and Optoelectronics, Key Laboratory of Optoelectronic Devices and Systems of Ministry of Education and Guangdong Province, College of Optoelectronic Engineering, Shenzhen University, Shenzhen 518060, China
  • 2Faculty of Information Technology, Macau University of Science and Technology, Macao, China
  • 3College of Chemistry and Environmental Engineering, Shenzhen University, Shenzhen 518060, China
  • 4School of Materials Science and Energy Engineering, Foshan University, Foshan 528000, China
  • 5e-mail: jiangxtemail@sina.com
  • 6e-mail: chenhongcs@126.com
  • show less
    DOI: 10.1364/PRJ.7.000494 Cite this Article Set citation alerts
    Zhongjian Xie, Feng Zhang, Zhiming Liang, Taojian Fan, Zhongjun Li, Xiantao Jiang, Hong Chen, Jianqing Li, Han Zhang. Revealing of the ultrafast third-order nonlinear optical response and enabled photonic application in two-dimensional tin sulfide[J]. Photonics Research, 2019, 7(5): 494 Copy Citation Text show less
    Typical characterizations of the SnS NSs. (a) TEM image; (b) AFM image; (c) crystal lattice shown by HRTEM image and corresponding FFT; (d) crystalline features shown by SAED; (e) XRD pattern; (f) Raman spectra of bulk SnS and exfoliated SnS NSs; (g) element distribution mapping via STEM.
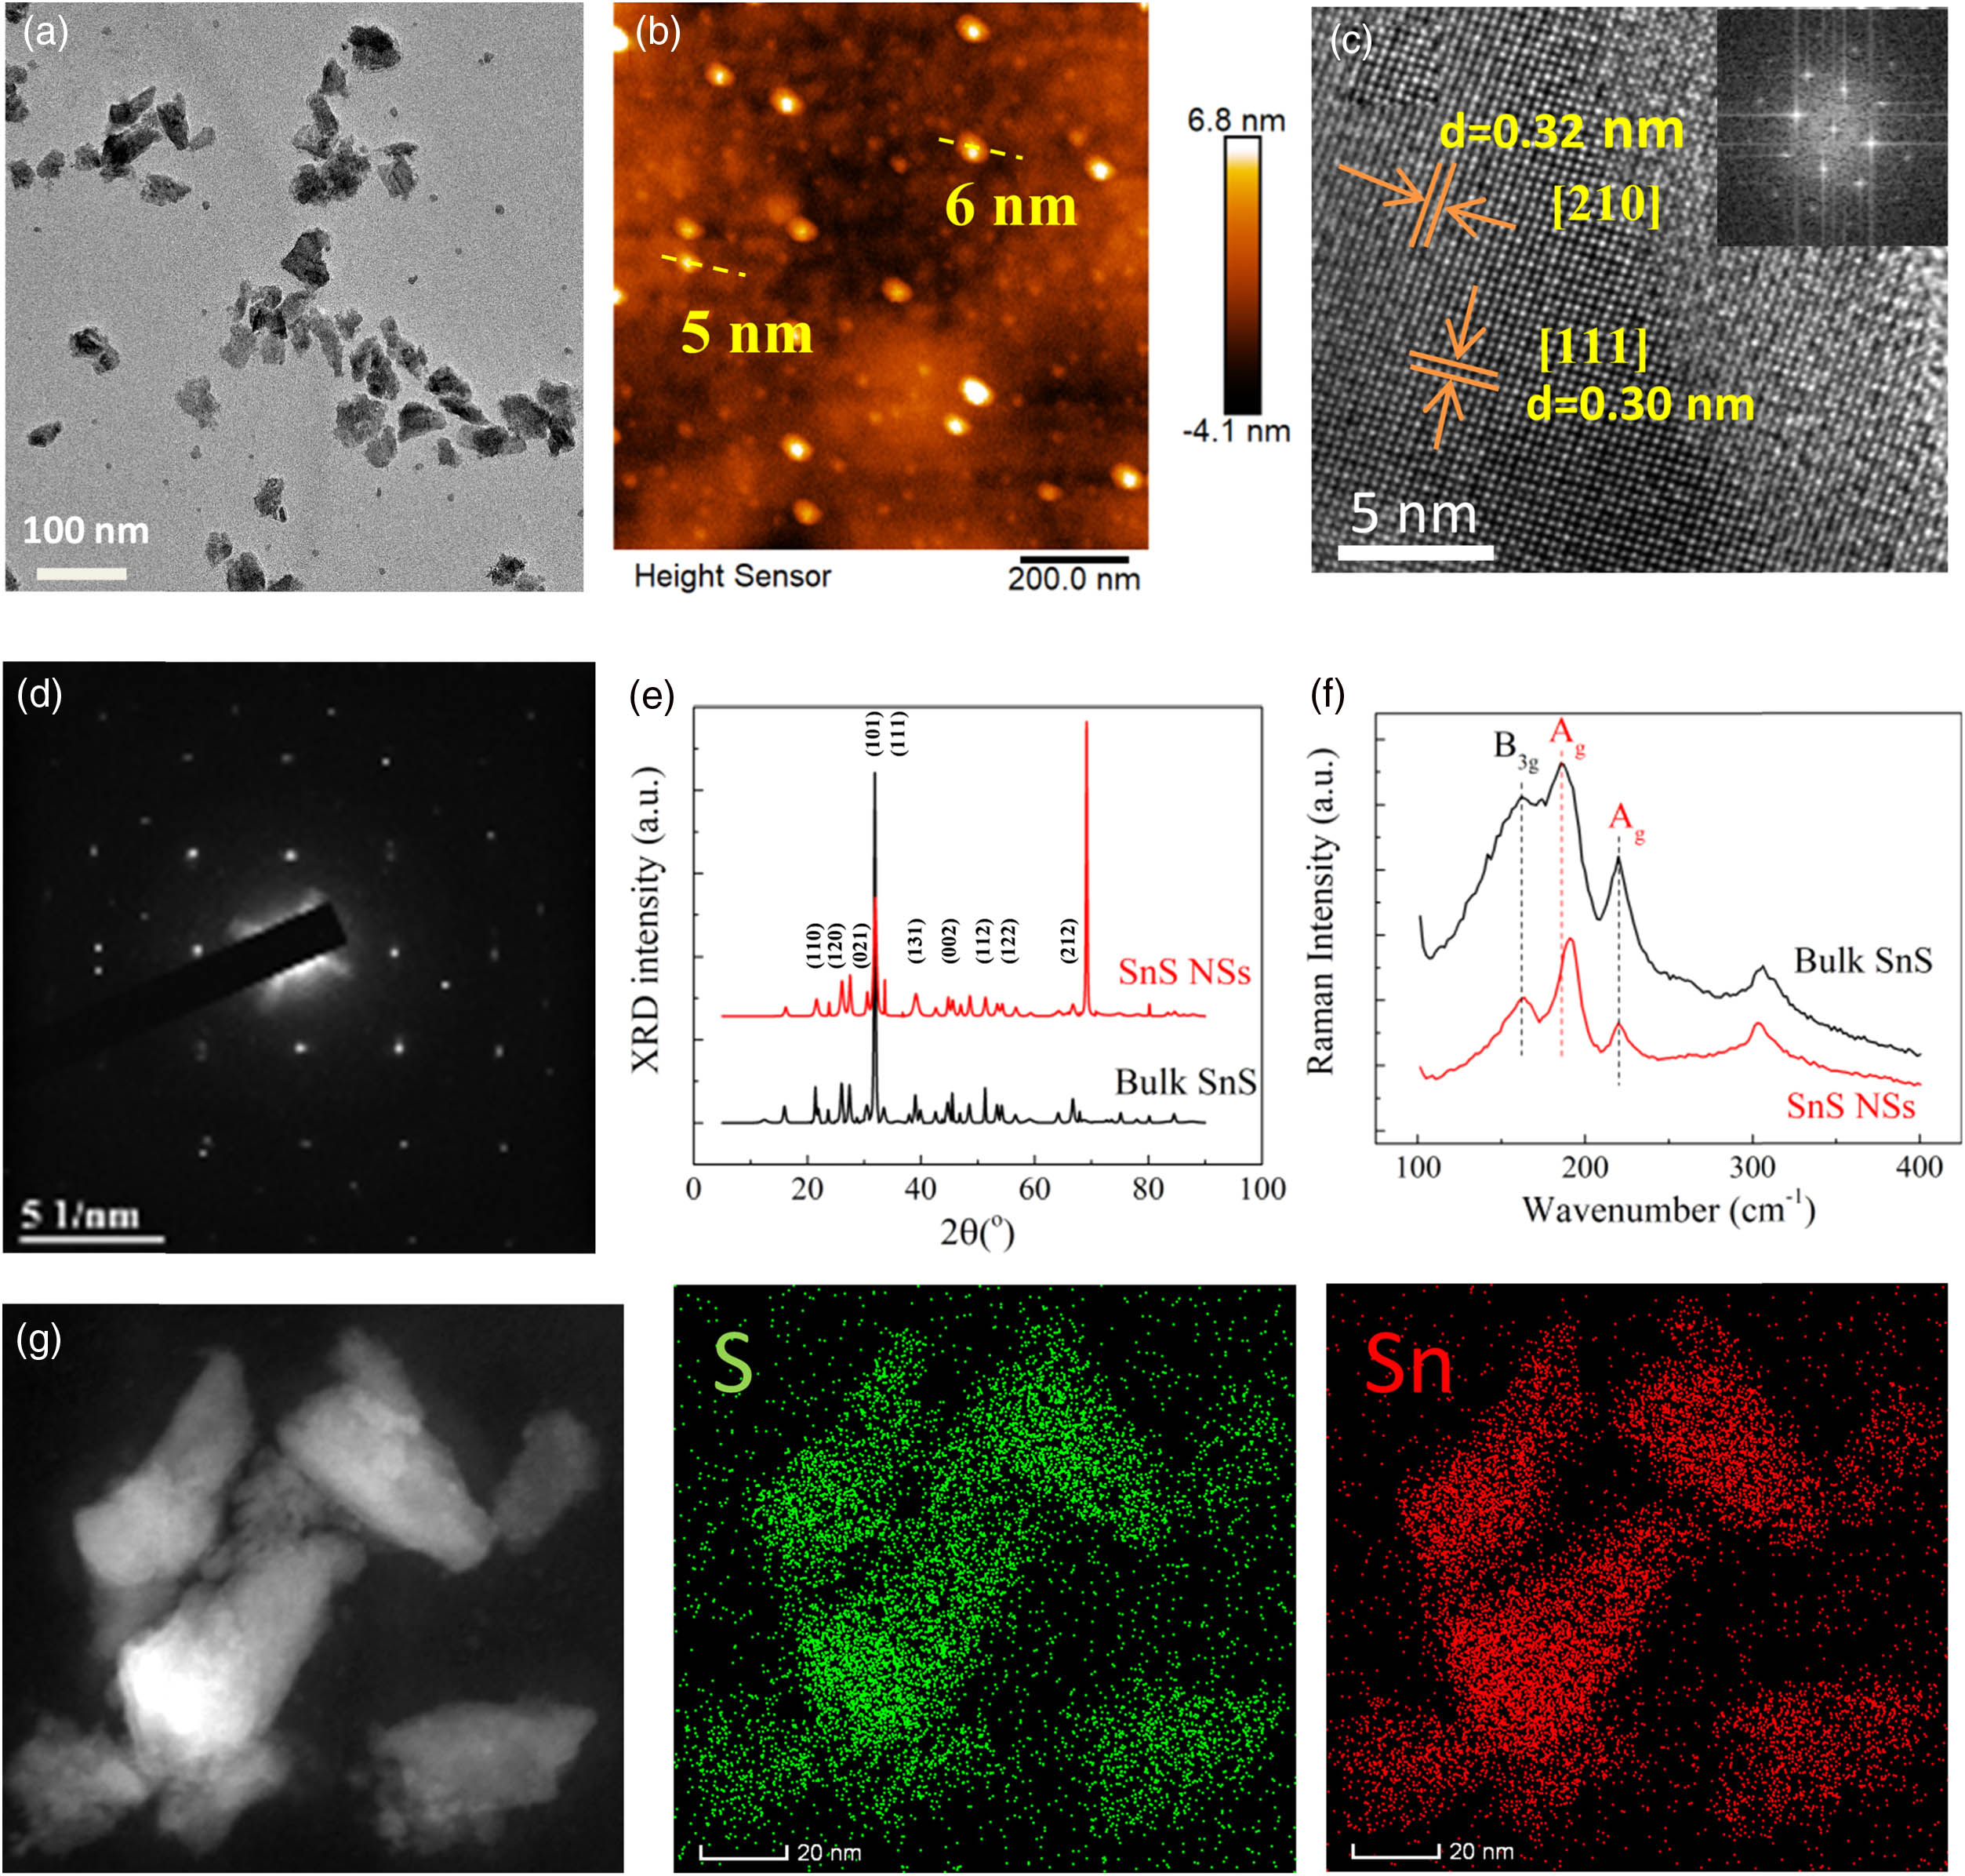
    Fig. 1. Typical characterizations of the SnS NSs. (a) TEM image; (b) AFM image; (c) crystal lattice shown by HRTEM image and corresponding FFT; (d) crystalline features shown by SAED; (e) XRD pattern; (f) Raman spectra of bulk SnS and exfoliated SnS NSs; (g) element distribution mapping via STEM.
    Stability of SnS NSs in ambient conditions characterized by (a) absorbance, (b)XRD, (c) Raman, and (d) XPS spectra, respectively.
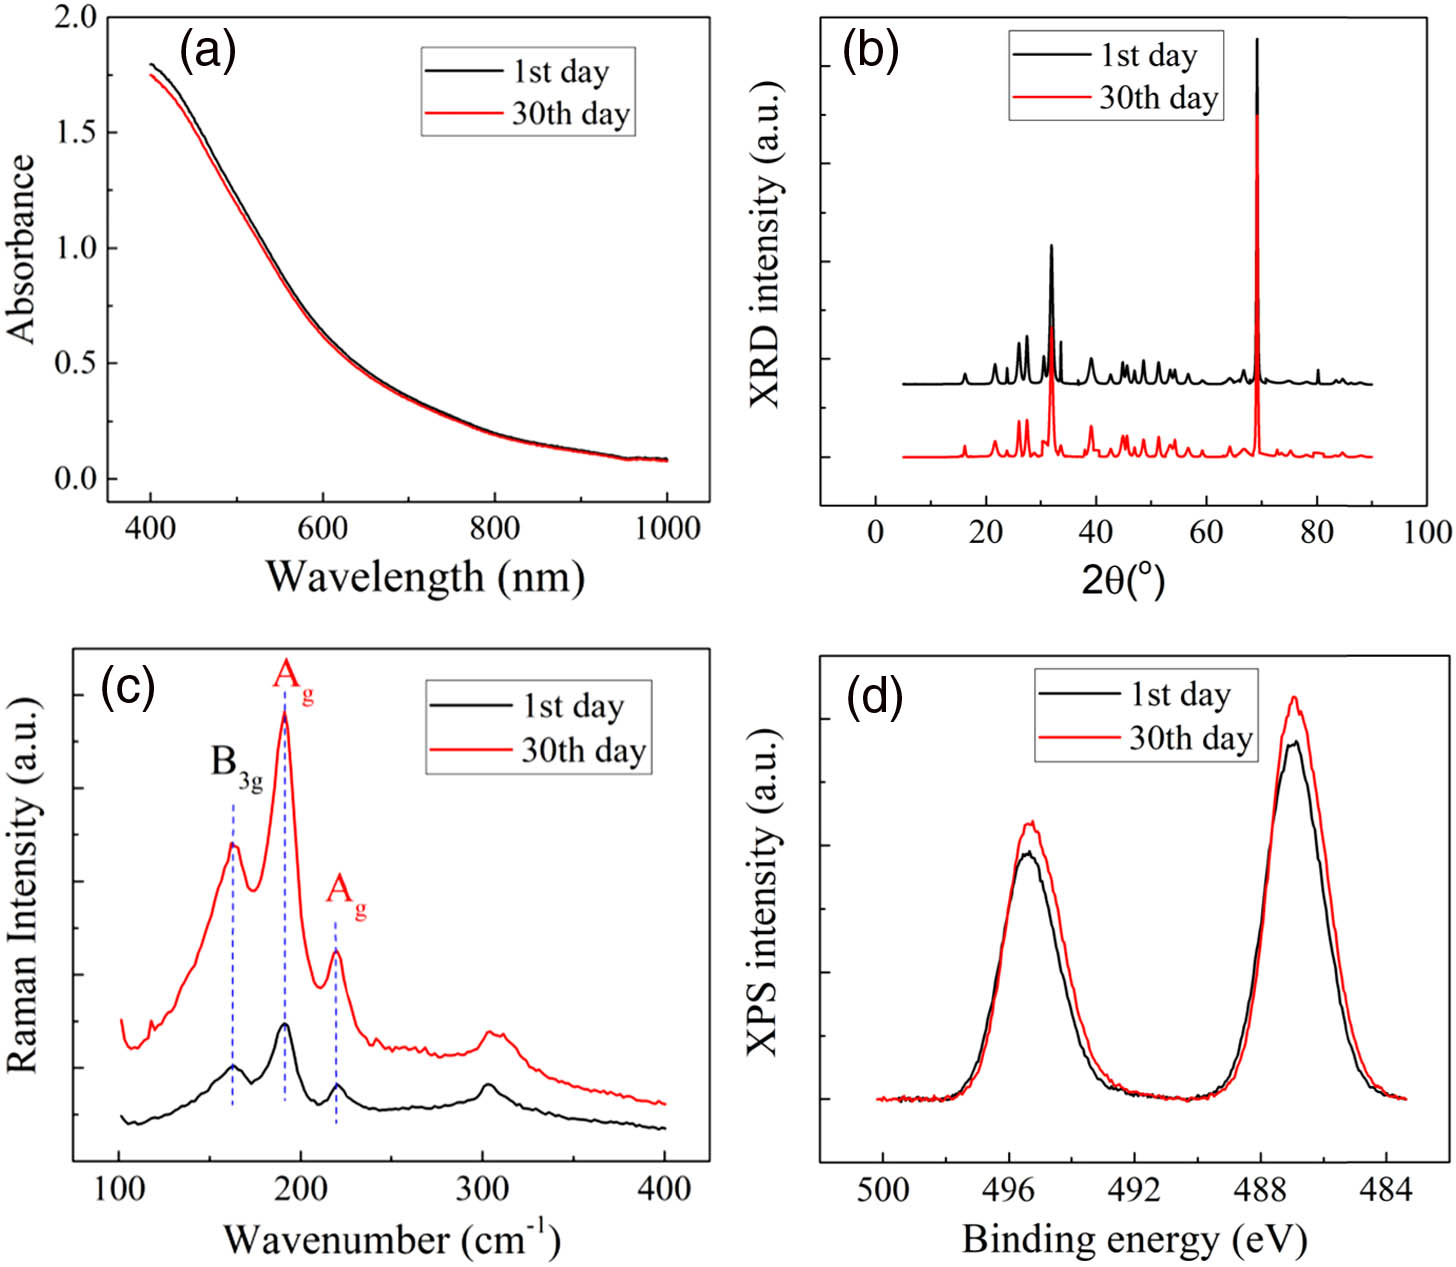
    Fig. 2. Stability of SnS NSs in ambient conditions characterized by (a) absorbance, (b)XRD, (c) Raman, and (d) XPS spectra, respectively.
    (a) Linear optical absorption spectrum of SnS NSs from the UV to NIR region in IPA solution. The baseline of IPA has been removed. (b) Corresponding Tauc plot of the linear optical absorption spectrum.
    Fig. 3. (a) Linear optical absorption spectrum of SnS NSs from the UV to NIR region in IPA solution. The baseline of IPA has been removed. (b) Corresponding Tauc plot of the linear optical absorption spectrum.
    Normalized transmittance versus z axis at different pulse energies [(a) 800 nm, (c) 1550 nm], and the corresponding intensity-dependent transmittance fitted via a two-level energy model [(b) 800 nm, (d) 1550 nm].
    Fig. 4. Normalized transmittance versus z axis at different pulse energies [(a) 800 nm, (c) 1550 nm], and the corresponding intensity-dependent transmittance fitted via a two-level energy model [(b) 800 nm, (d) 1550 nm].
    (a) TA spectra of the SnS sample in the time scale of 0–5.0 ps; (b) 2D mapping of the TA spectrum from 1000 to 1500 nm; (c) principal dynamic figured out by singular value decomposition; (d) decay time τ1 and τ2 versus the probe wavelength.
    Fig. 5. (a) TA spectra of the SnS sample in the time scale of 0–5.0 ps; (b) 2D mapping of the TA spectrum from 1000 to 1500 nm; (c) principal dynamic figured out by singular value decomposition; (d) decay time τ1 and τ2 versus the probe wavelength.
    Q-switched pulse trains at different pump powers. (a) 275 mW with repetition rate of 36.36 kHz; (b) 300 mW with repetition rate of 38.91 kHz; (c) 325 mW with repetition rate of 41.32 kHz; (d) 400 mW with repetition rate of 49.43 kHz; (e) 500 mW with repetition rate of 65.19 kHz; (f) long-term stability of the Q-switched state.
    Fig. 6. Q-switched pulse trains at different pump powers. (a) 275 mW with repetition rate of 36.36 kHz; (b) 300 mW with repetition rate of 38.91 kHz; (c) 325 mW with repetition rate of 41.32 kHz; (d) 400 mW with repetition rate of 49.43 kHz; (e) 500 mW with repetition rate of 65.19 kHz; (f) long-term stability of the Q-switched state.
    (a) Evolution of averaged output power and pulse repetition rate as the pump power increases; (b) RF spectrum under the pump power of 325 mW.
    Fig. 7. (a) Evolution of averaged output power and pulse repetition rate as the pump power increases; (b) RF spectrum under the pump power of 325 mW.
    Mode-locked performance. (a) Optical spectrum; (b) pulse train; (c) autocorrelation trace; (d) RF spectrum.
    Fig. 8. Mode-locked performance. (a) Optical spectrum; (b) pulse train; (c) autocorrelation trace; (d) RF spectrum.
    (a) Long-term operation of SnS NSs-based mode locking and (b) its tunable wavelength.
    Fig. 9. (a) Long-term operation of SnS NSs-based mode locking and (b) its tunable wavelength.
     LT (%)ΔT (%)Tns (%)Is  (GW/cm2)β  (103  cm/GW)Imχ(3)  (1021  m2/V2)
    SnS@800nm35.936.427.734.8±1.2(50.5±3.4)4.25±0.28
    SnS@1550 nm50.412.537.183.5±2.5(14.1±0.3)2.30±0.05
    BP@800 nm85.612.41.9334.6±43(6.17±0.19)
    Table 1. Value of LT, ΔT, Tns, Is, β, Im χ(3) for SnS@800 nm, 1550 nm and BP@800 nm under the pulse energy of 1.3 μJ/pulse and 1.0 μJ/pulse
    Zhongjian Xie, Feng Zhang, Zhiming Liang, Taojian Fan, Zhongjun Li, Xiantao Jiang, Hong Chen, Jianqing Li, Han Zhang. Revealing of the ultrafast third-order nonlinear optical response and enabled photonic application in two-dimensional tin sulfide[J]. Photonics Research, 2019, 7(5): 494
    Download Citation