• Photonics Research
  • Vol. 9, Issue 10, 1948 (2021)
Liwei Tang1、2, Hongxiang Jia1、2, Shuai Shao1、2, Sigang Yang1、2, Hongwei Chen1、2, and Minghua Chen1、2、*
Author Affiliations
  • 1Department of Electronic Engineering, Tsinghua University, Beijing 100084, China
  • 2Beijing National Research Center for Information Science and Technology (BNRist), Beijing 100084, China
  • show less
    DOI: 10.1364/PRJ.428837 Cite this Article Set citation alerts
    Liwei Tang, Hongxiang Jia, Shuai Shao, Sigang Yang, Hongwei Chen, Minghua Chen. Hybrid integrated low-noise linear chirp frequency-modulated continuous-wave laser source based on self-injection to an external cavity[J]. Photonics Research, 2021, 9(10): 1948 Copy Citation Text show less
    Schematic diagram of the proposed hybrid FMCM laser source. The DFB laser is coupled with an MRR where the blue lines represent the waveguides; the red lines represent the phase and MRR electrodes.
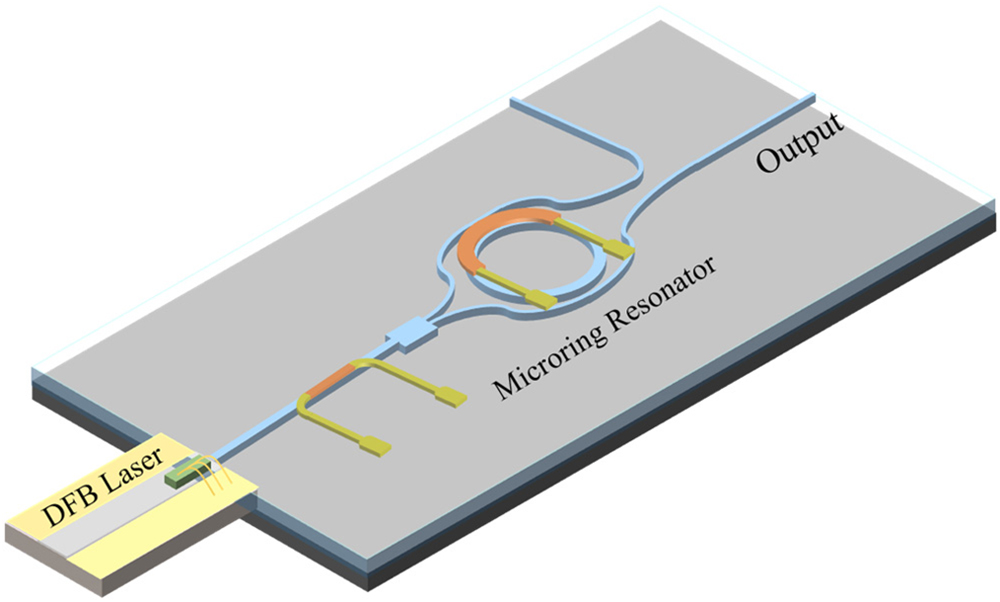
    Fig. 1. Schematic diagram of the proposed hybrid FMCM laser source. The DFB laser is coupled with an MRR where the blue lines represent the waveguides; the red lines represent the phase and MRR electrodes.
    Output frequency detuning with respect to the MRR resonance frequency.
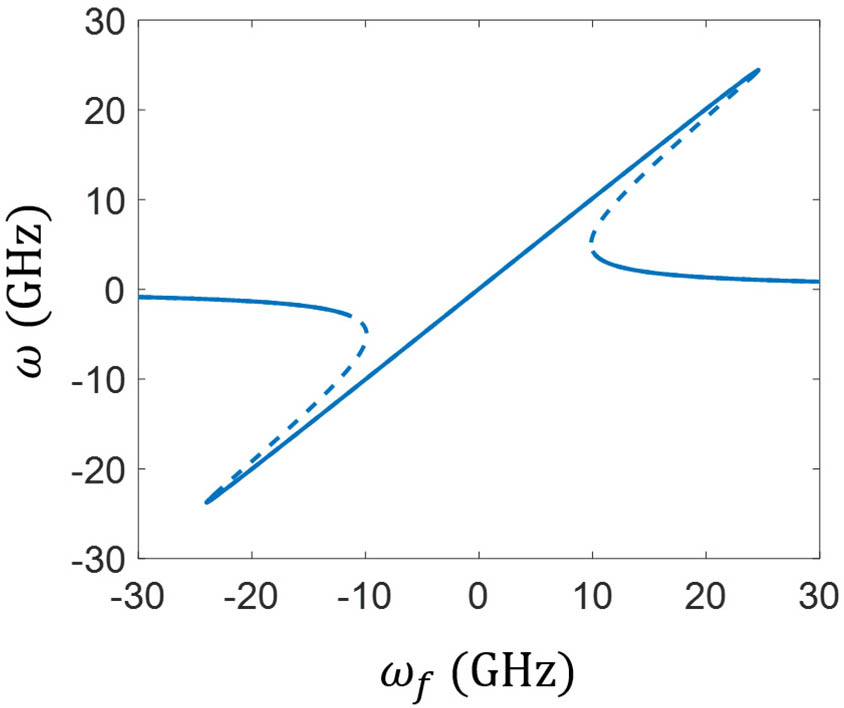
    Fig. 2. Output frequency detuning with respect to the MRR resonance frequency.
    (a) Cross-section schematic of the Si3N4 waveguide platform. (b) Microscope photo of the fabricated MRR. (c) Microscope photo of the hybrid laser. (d) Measured transmission spectra from the input port to the output port of the MRR. (e) Measured reflection spectra at the input port of the MRR with an FSR of 0.40 nm, equivalent to 50 GHz. (f) Enlarged view of transmission and reflection spectra of the dashed line in (d) and (e) where the measured data and Lorentz-type fitted curve are plotted by dots and dashed lines.
    Fig. 3. (a) Cross-section schematic of the Si3N4 waveguide platform. (b) Microscope photo of the fabricated MRR. (c) Microscope photo of the hybrid laser. (d) Measured transmission spectra from the input port to the output port of the MRR. (e) Measured reflection spectra at the input port of the MRR with an FSR of 0.40 nm, equivalent to 50 GHz. (f) Enlarged view of transmission and reflection spectra of the dashed line in (d) and (e) where the measured data and Lorentz-type fitted curve are plotted by dots and dashed lines.
    (a) Experimental diagram of the test scheme. LUT, laser under test; PC, polarization controller. (b) The output spectra under static continuous frequency tuning. By tuning the phase and MRR electrode, the wavelength is detuned from 1548.631 nm to 1548.928 nm with an SMSR of 50 dB. (c) Frequency noise spectrum from 100 Hz to 10 MHz at static operation. The red and blue lines are frequency noise spectrum during free-running and self-injection locked operation, respectively. White frequency noise of free-running and self-injection locked states is respectively marked out in the figure.
    Fig. 4. (a) Experimental diagram of the test scheme. LUT, laser under test; PC, polarization controller. (b) The output spectra under static continuous frequency tuning. By tuning the phase and MRR electrode, the wavelength is detuned from 1548.631 nm to 1548.928 nm with an SMSR of 50 dB. (c) Frequency noise spectrum from 100 Hz to 10 MHz at static operation. The red and blue lines are frequency noise spectrum during free-running and self-injection locked operation, respectively. White frequency noise of free-running and self-injection locked states is respectively marked out in the figure.
    Characteristics of continuous frequency tuning. (a) MRR and phase tuning voltage and output power corresponding to the detuning frequency. The measured wavelength band is from 1548.65 nm to 1548.79 nm. The x axis represents a frequency offset from 1548.65 nm. Starting from 1548 nm, at intervals of 1 GHz, the output power and detuning voltage are recorded in the diagram. (b) The detuning frequency with respect to the MRR detuning power. The square of the MRR voltage represents the thermal power.
    Fig. 5. Characteristics of continuous frequency tuning. (a) MRR and phase tuning voltage and output power corresponding to the detuning frequency. The measured wavelength band is from 1548.65 nm to 1548.79 nm. The x axis represents a frequency offset from 1548.65 nm. Starting from 1548 nm, at intervals of 1 GHz, the output power and detuning voltage are recorded in the diagram. (b) The detuning frequency with respect to the MRR detuning power. The square of the MRR voltage represents the thermal power.
    Schematic of iterative learning pre-distortion linearization.
    Fig. 6. Schematic of iterative learning pre-distortion linearization.
    (a)–(c) Time-dependent driving voltage of phase and MRR electrodes by iterative learning. (d)–(f) Time-frequency spectrum of the beat note by the FMCW laser source with reference laser. (g)–(i) Frequency spectrum of the heterodyne beat note with RBW=51 kHz, VBW=20 kHz, span=15 GHz. (j)–(l) The residual nonlinear frequency error νres(t) of the up ramp and down ramp at a chirped period. The chirped frequency is 100 Hz for (a), (d), (g), (j), 500 Hz for (b), (e), (h), (k), and 1 kHz for (c), (f), (i), (l), respectively.
    Fig. 7. (a)–(c) Time-dependent driving voltage of phase and MRR electrodes by iterative learning. (d)–(f) Time-frequency spectrum of the beat note by the FMCW laser source with reference laser. (g)–(i) Frequency spectrum of the heterodyne beat note with RBW=51  kHz, VBW=20  kHz, span=15  GHz. (j)–(l) The residual nonlinear frequency error νres(t) of the up ramp and down ramp at a chirped period. The chirped frequency is 100 Hz for (a), (d), (g), (j), 500 Hz for (b), (e), (h), (k), and 1 kHz for (c), (f), (i), (l), respectively.
    (a) Experimental setup for performance evaluation of FMCW laser source. FUT, fiber under test; DAQ, data acquisition card. (b)–(g) Demodulated fiber distance which is calculated only by fast Fourier transform (FFT) of the beat signal from the DAQ. The red curve and blue curve represent the result with a fiber length difference of 3 m. The experimental results of 340 m long fiber of (b) up and (e) down ramps with 1 kHz chirped frequency. The experimental results of 45 km long fiber of (c), (d) up and (f), (g) down ramps with 1 kHz chirped frequency where (d), (g) are the enlarged view of the peak frequency in (c), (f), respectively.
    Fig. 8. (a) Experimental setup for performance evaluation of FMCW laser source. FUT, fiber under test; DAQ, data acquisition card. (b)–(g) Demodulated fiber distance which is calculated only by fast Fourier transform (FFT) of the beat signal from the DAQ. The red curve and blue curve represent the result with a fiber length difference of 3 m. The experimental results of 340 m long fiber of (b) up and (e) down ramps with 1 kHz chirped frequency. The experimental results of 45 km long fiber of (c), (d) up and (f), (g) down ramps with 1 kHz chirped frequency where (d), (g) are the enlarged view of the peak frequency in (c), (f), respectively.
       Up RampDown Ramp
    Chirp Frequency (Hz)Bandwidth (GHz)Chirp Rate (GHz/ms)1R2νrms (MHz)ROI1R2νrms (MHz)ROI
    10010.32.13.0×1081.1990%2.6×1080.9390%
    5008.68.63.6×1090.2690%8.8×1090.7690%
    10005.611.15.3×1090.2290%4.1×1090.2190%
    Table 1. Parameters of the Generated FMCW Signal
    Liwei Tang, Hongxiang Jia, Shuai Shao, Sigang Yang, Hongwei Chen, Minghua Chen. Hybrid integrated low-noise linear chirp frequency-modulated continuous-wave laser source based on self-injection to an external cavity[J]. Photonics Research, 2021, 9(10): 1948
    Download Citation