
Liwei Tang, Hongxiang Jia, Shuai Shao, Sigang Yang, Hongwei Chen, Minghua Chen, "Hybrid integrated low-noise linear chirp frequency-modulated continuous-wave laser source based on self-injection to an external cavity," Photonics Res. 9, 1948 (2021)
- Photonics Research
- Vol. 9, Issue 10, 1948 (2021)
Abstract
1. INTRODUCTION
The frequency-modulated laser source is the essential equipment of many detection systems, such as the frequency-modulated continuous-wave (FMCW) light detection and ranging (LiDAR), pulse compression LiDAR, large-band linearly chirped microwave generation, and coherent optical frequency domain reflectometry (OFDR) [1–4]. Compared with the conventional time-of-flight LiDAR, the FMCW LiDAR has more promising performance in autonomous vehicles and aerial photography due to its advantages of eye-safe continuous power, high repetition frequency, and simultaneous measurement of velocity and location [5]. For FMCW coherent detection, the range resolution is relative to the frequency bandwidth and the frequency modulation linearity. A relatively longer chirped period provides abundant energy accumulation and improves the signal-to-noise ratio (SNR) of the detected echo beat signal. The time-bandwidth product (TBWP) of the generated microwave can adequately describe this characteristic [6]. Moreover, the narrow linewidth or low-frequency noise of the LiDAR source provides a high coherent range and increases the potential detectable distance.
However, it is not easy for the FMCW laser source to simultaneously satisfy narrow linewidth, high chirp linearity, and large TBWP. The famous Fourier-domain mode-locked laser realizes 100 nm tuning bandwidth with coherent continuous sweeping [7]. Nevertheless, it fails to achieve a low-frequency noise because the distributed environmental perturbations will induce phase fluctuations of the stored longitudinal modes in tens of kilometers of fiber. The chirped temporal duration should be equal to the long fiber time delay, so the severe instability is induced, and the TBWP thus is limited to
With the development of silicon photonics technology, it is a trend to reduce the linewidth by coupling the high-quality (high-Q) microresonator with a semiconductor laser. By self-injection locking, the formed compound cavity can prolong the photon lifetime, suppress the amplified spontaneous emission noise, reduce the spectral linewidth, and improve the coherent time. A high-Q whispering gallery mode microresonator coupled with a distributed feedback (DFB) laser is used to achieve the sub-100 Hz linewidth [10]. However, their laser has no frequency modulation functions under the self-injection locked state.
Sign up for Photonics Research TOC. Get the latest issue of Photonics Research delivered right to you!Sign up now
In this paper, an FMCW laser source based on a self-injection locked commercial DFB laser diode (LD) coupled with a high-Q
2. PRINCIPLE
As shown in Fig. 1, the proposed FMCW laser source consists of a DFB LD and an external MRR. The MRR is designed as the add-drop single ring type, of which the input and drop ports are connected through a multimode interferometer (MMI). The output port of the MRR is coupled to a single-mode fiber (SMF) as the output of the laser source, while another add port of the MRR is left connected. On the top of the waveguides, two thermal detuning electrodes are fabricated, one of which is on the input waveguide before the MMI for detuning the phase delay, and another is on the ring waveguide for detuning the central resonant frequency. Sufficient optical feedback from the MRR is injected into the DFB laser, enabling a significant spectral linewidth reduction.
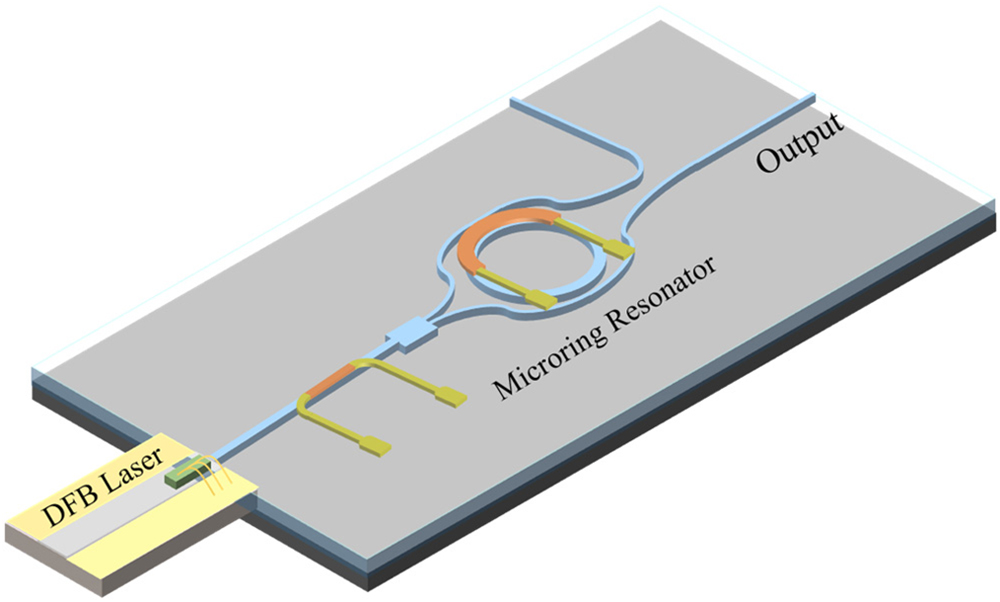
Figure 1.Schematic diagram of the proposed hybrid FMCM laser source. The DFB laser is coupled with an MRR where the blue lines represent the waveguides; the red lines represent the phase and MRR electrodes.
The effect of self-injection has been well studied. It can be divided into five regimes depending on the feedback ratio [11]. From low to high feedback ratio, the regimes are described as Regime I to Regime V. The feedback strength can be improved when the MRR central resonant frequency is close to the solitary frequency of DFB by tuning the MRR electrode. When the feedback ratio exceeds 10%, the DFB laser enters the Regime V, showing a stable single-longitudinal mode output with narrow linewidth. Under this state, the role of the MRR in the FMCW laser can be simplified into two parameters, viz. the full width at half-maximum (FWHM) spectral linewidth
The dynamical response of the self-injected laser can be described by the equation [13]
The locking state is the result of the synchronous tuning of the phase and MRR electrodes, which can be explained by solving the relationship between
![]()
Figure 2.Output frequency detuning with respect to the MRR resonance frequency.
Under the locked state, the linear frequency-modulated area only appears if the external round-trip time is less than a specific value. Figure 2 is plotted with the external round-trip time
3. DESIGN AND FABRICATION
The MRR is fabricated based on the
The employed
![]()
Figure 3.(a) Cross-section schematic of the
As for the design of the MRR, the waveguide width is optimized to 2.7 μm for the low-loss TE mode propagation. The FWHM of the cold laser cavity of the DFB laser diode is about 50 GHz [10]. Therefore, the ring is designed to be 1.2 mm in diameter to achieve an free spectral range (FSR) of 50 GHz so that only one single feedback resonant frequency of the MRR is allowed in the bandwidth of the cold cavity to avoid multimode resonance. The gap between the ring waveguide and the bus waveguide is optimized to be 1 μm for high phase delay. The input waveguide is designed as a spot-size converter (SSC) to match the mode field shape of the DFB. The fabricated MRR is demonstrated in Fig. 3(b).
The transmission and reflection spectra of the MRR are measured by the advanced optical spectrum analyzer (OSA, APEX 2081), which has a built-in broadband tunable laser source with a spectral resolution of 0.16 pm (equivalent to 20 MHz) and a bandwidth that covers the whole C-band. Figures 3(d) and 3(e) demonstrate the transmission spectra and reflection spectra at 1550 nm with a 5 nm span, showing an FSR of 0.40 nm (equivalent to 50 GHz). The enlarged view of the spectra near 1551 nm is plotted in Fig. 3(e), where the Lorentz-type function is employed to fit the curve [23]. The FWHM of the spectra is 310 MHz, and the Q value is calculated to be
The DFB laser diode is commercially available, and the butt coupling is employed in this hybrid laser source, as shown in Fig. 3(c). The SSC is a straight waveguide with a gradually narrower width, which has reduced the butt-coupling loss to be less than
4. EXPERIMENTAL RESULTS
A. Static Operation
The packaged hybrid laser is first tested under the DC pumping state, the test scheme of which is shown in Fig. 4(a). By adjusting the phase and MRR voltages, the output mode evolves to a self-injection locked state from a multimode, chaotic state, whose spectra are monitored by the OSA [24]. Figure 4(b) shows the self-injection locked state at 1548.6 nm, showing a single-longitudinal mode with a side-mode suppression ratio (SMSR) of 50 dB. Under self-injection locked state, tuning MRR, and phase electrodes, the wavelength is shifted continuously from 1548.631 nm to 1548.928 nm, equivalent to 42 GHz frequency bandwidth. The optical power in the fiber is 0 dBm, while the free-running power is 10 dBm. The lost power is mainly from the following four aspects. (1) The edge butt coupling loss between the DFB and silicon photonic chip is
![]()
Figure 4.(a) Experimental diagram of the test scheme. LUT, laser under test; PC, polarization controller. (b) The output spectra under static continuous frequency tuning. By tuning the phase and MRR electrode, the wavelength is detuned from 1548.631 nm to 1548.928 nm with an SMSR of 50 dB. (c) Frequency noise spectrum from 100 Hz to 10 MHz at static operation. The red and blue lines are frequency noise spectrum during free-running and self-injection locked operation, respectively. White frequency noise of free-running and self-injection locked states is respectively marked out in the figure.
The spectral characteristics of the static output are measured with the scheme where an unbalanced Mach–Zehnder interferometer (MZI) is used to obtain the laser frequency discriminating spectrum at a self-injection locked state [26]. As shown in Fig. 4(a), the length difference between the two arms is 20 m. The acousto-optic modulator is placed on the shorter arm to prevent homodyne interference. After photodiode (PD) envelope detection, the output signal is fed into the signal source analyzer (SSA, E5052B, Keysight). The unbalanced MZI has a sub-coherence time delay, and the fluctuation of the laser frequency is converted into the phase fluctuation of the beat note. The frequency noise and intrinsic laser linewidth can be identified by analyzing the heterodyne beat note’s phase noise spectral density (PNSD). This advanced measurement setup is similar to the more widely used delayed self-heterodyne interferometer (DSHI) [27]. However, for ultra-narrow linewidth evaluation, the DSHI scheme has lost its accuracy, and the measurement of frequency noise is more reasonable, which has been analyzed in detail [28,29].
The SSA obtains the single-sideband power spectral density
The frequency noise spectra
The low-frequency noise is dominant in coherent detection applications such as FMCW LiDAR and OFDR fiber sensing. The broadened frequency spectrum near the central frequency is mainly coming from the low-frequency noise. The integrated linewidth can represent the low-frequency noise, which can be obtained by integrating the frequency noise:
The PNSD in Fig. 4(c) is measured at a fixed point in the locked state. When the wavelength is redshift from 1548.8 nm, the output power is gradually dropped. It is the state before mode hopping where the locked position of the MRR has shifted. However, within the whole 42 GHz tunable band, the PNSD still maintains a low-frequency noise as Fig. 4(c) shows. The intrinsic and integral linewidth has not observed significant change. The single oscillating longitudinal mode and SMSR are maintained in the whole tunable band. For the dynamical system like the self-injection locked laser, the switching of the operation state is abrupt. Only when the wavelength exceeds 1548.928 nm, the mode hopping will occur immediately. It will maintain a stable narrow linewidth output within the locked area, whether under static or dynamic modulation. As mentioned above, the hysteresis effect under the locked Regime V expands the locking range. Once locked, the narrow linewidth, single oscillating mode, will remain until the next state is switched. Thus, a continuously tuning bandwidth of up to 42 GHz can be achieved within the locked band.
B. Linearly Chirped FMCW
In Fig. 4(a), the 42 GHz continuous frequency tuning band is obtained. For stable linearly chirped FMCW, select the wavelength bands from 1548.65 nm to 1548.79 nm (equivalent to 18 GHz) as the modulated bands. When the tuning range exceeds 1548.8 nm, the power decreases. Although it is still a stable single-longitudinal mode operation, there is a risk of mode hopping during fast frequency modulation. Figure 5(a) demonstrates the frequency detuning from 1548.65 nm with respect to MRR and phase tuning voltage. The resistance of phase and MRR electrodes is 78 Ω and 274 Ω, respectively. Therefore, the maximum power consumption of phase and MRR heaters is 304 mW and 252 mW, respectively. The output power drops when the frequency is lower than 5 GHz. The reason may be that the locked position is not stable. Although there is a sufficient ratio of optical feedback to enable strong self-injection locking, the lasing frequency fails to maintain stable tuning with the MRR’s resonant frequency. So the power is reduced due to the filtering effect of the MRR. As the aforementioned two-dimensional tuning method, the MRR is mainly used to tune the output frequency while the phase electrode is used for compensation. If the phase compensation is not keeping up with the MRR, the mode hopping will occur. So the phase delay
![]()
Figure 5.Characteristics of continuous frequency tuning. (a) MRR and phase tuning voltage and output power corresponding to the detuning frequency. The measured wavelength band is from 1548.65 nm to 1548.79 nm. The
Here, we employ the iterative learning pre-distortion linearization of the hybrid laser source [33]. The schematic is shown in Fig. 6, which has been proven effective in generating periodic modulated signals [34]. The FMCW laser source first passes the 20 m delayed unbalanced MZI to obtain the differential frequency. The PD receives the delayed self-homodyne signal. Then the phase
![]()
Figure 6.Schematic of iterative learning pre-distortion linearization.
However, the obtained
Considering that heat conduction is the first derivative with time, the iterative learning variables need to use derivatives of residual difference
![]()
Figure 7.(a)–(c) Time-dependent driving voltage of phase and MRR electrodes by iterative learning. (d)–(f) Time-frequency spectrum of the beat note by the FMCW laser source with reference laser. (g)–(i) Frequency spectrum of the heterodyne beat note with
In addition, we also demonstrate the experimental results of 100 Hz and 1 kHz chirp frequency. The time-dependent driving voltages they employ are shown in Figs. 7(a)–7(c). The STFT time-frequency spectra are shown in Figs. 7(d)–7(f). The frequency spectra of the beat note by the FMCW laser source with the reference laser are shown in Figs. 7(g)–7(i). Nonlinear frequency residual errors
With a frequency bandwidth of 10.3 GHz and a sweep speed of 100 Hz, the microwave waveform generates ultra-large TBWP of
C. Experiment of Fiber Length Measurement
In order to evaluate the performance of the FMCW laser source, the fiber under test (FUT) length measurement experiment is set up, as shown in Fig. 8. Two fibers with lengths of 350 m and 45 km are chosen to be measured. In each measurement, a 3 m fiber is connected to the FUT for testing the distance resolution. Figures 8(b)–8(g) show the Fourier spectrum of the beat note where the
![]()
Figure 8.(a) Experimental setup for performance evaluation of FMCW laser source. FUT, fiber under test; DAQ, data acquisition card. (b)–(g) Demodulated fiber distance which is calculated only by fast Fourier transform (FFT) of the beat signal from the DAQ. The red curve and blue curve represent the result with a fiber length difference of 3 m. The experimental results of 340 m long fiber of (b) up and (e) down ramps with 1 kHz chirped frequency. The experimental results of 45 km long fiber of (c), (d) up and (f), (g) down ramps with 1 kHz chirped frequency where (d), (g) are the enlarged view of the peak frequency in (c), (f), respectively.
Figures 8(c)–8(g) show the measurements with longer FUT. Without an extra fiber, the measured lengths are 45,376.82 m and 45,375.12 m of the up and down ramps. With an extra 3 m fiber, the total lengths are measured to be 45,380.43 m and 45,379.49 m for the up and down ramps. Thus, the extra fiber lengths are calculated to be 3.61 m and 4.37 m. Compared with the results of shorter FUT, the demodulation spectrum has the following changes. (1) The wings of the spectrum are broadened and side peaks appear, which causes the inaccurate measured length and resolution. The reason may be the nonlinear error accumulation where the wings are broadened as the time delay increases. The expanded spectrum is multiplied with the Fourier transform of the time window, resulting in the side peaks in Figs. 8(d) and 8(g). (2) The SNR has been decreased from 70 dB of 350 m to 19 dB of 45 km. The decrease of SNR is mainly from spectral broadening. In Figs. 8(b) and 8(e), the SNR is limited by the noise floor of
5. DISCUSSION
The phase-MRR two-dimensional tuning method for extensive bandwidth frequency modulation overcomes the limitation in the self-injection locked state. The ultra-low frequency noise enables an ultra-long-distance measurement and high linearity provides more accurate distance resolution without compensation algorithms. It can distinguish the length of 3 m difference at 45 km distance. However, the dynamic range is limited by the thermo-optic feature. The frequency bandwidth decreases with the increase of chirped speed. Indeed, for the sake of insurance, we only chose 20 GHz of the static bands for the base of the dynamic FMCW range. Unfortunately, the FMCW source still failed to realize the same tuning range as the static operation, which is even worse at a relatively high chirped frequency when the bandwidth is reduced to 5.6 GHz at 1 kHz chirped frequency. The pre-distortion requires an overload driving voltage signal, which is a heavy power consumption that cannot be ignored. The 20 GHz offset tuning requires the heater driving powers of 304 mW and 252 mW of the phase and MRR, so if the FMCW source wants to achieve more wide sweep bandwidth, a higher-power driving source needs to be prepared, and the trouble of mode hopping should be considered. The proposed on-chip FMCW laser source has a fiber coupling optical power of 0 dBm. If it wants to be used in a space LiDAR measurement system, the master oscillator power amplifier system needs to be used to amplify the power [39]. So the proposed FMCW laser source can improve the SNR of the echo signal, while it also has limitations in the application calling for fast modulated speed and high optical power, such as 3D object imaging [40].
6. CONCLUSIONS
A hybrid integrated on-chip FMCW laser source based on self-injection is proposed. The static tuning range is up to 42 GHz with 49.9 Hz intrinsic linewidth and dynamic FMCW experiment achieves 10.3 GHz bandwidth at 100 Hz chirped frequency and 5.6 GHz bandwidth at 1 kHz chirped frequency by two-dimensional thermal tuning. The generated microwave waveform has a large TBWP up to
References
[1] C.-H. Yang, Y. Zhang, C.-F. Jin, L. Xu, X. Yang, Q. Wang, Y.-H. Liu, Y. J. Zhao. A scheme of pulse compression lidar with enhanced modulated bandwidth for detection through scattering media. Opt. Commun., 381, 205-209(2016).
[2] X. Zhang, J. Pouls, M. C. Wu. Laser frequency sweep linearization by iterative learning pre-distortion for FMCW LiDAR. Opt. Express, 27, 9965-9974(2019).
[3] P. Zhou, F. Zhang, Q. Guo, S. J. Pan. Linearly chirped microwave waveform generation with large time-bandwidth product by optically injected semiconductor laser. Opt. Express, 24, 18460-18467(2016).
[4] M. Wegmuller, J. Von Der Weid, P. Oberson, N. Gisin. High resolution fiber distributed measurements with coherent OFDR. ECOC’00, 109(2000).
[5] D. F. Pierrottet, F. Amzajerdian, L. Petway, B. Barnes, G. Lockard, M. J. Rubio. Linear FMCW laser radar for precision range and vector velocity measurements. MRS Online Proc. Library Archive, 1076, 10760406(2008).
[6] A. Vasilyev. The Optoelectronic Swept-Frequency Laser and Its Applications in Ranging, Three-Dimensional Imaging, and Coherent Beam Combining of Chirped-Seed Amplifiers(2013).
[7] R. Huber, M. Wojtkowski, J. J. Fujimoto. Fourier domain mode locking (FDML): a new laser operating regime and applications for optical coherence tomography. Opt. Express, 14, 3225-3237(2006).
[8] J. Tang, B. Zhu, W. Zhang, M. Li, S. Pan, J. J. Yao. Hybrid Fourier-domain mode-locked laser for ultra-wideband linearly chirped microwave waveform generation. Nat. Commun., 11, 3814(2020).
[9] H. Gao, C. Lei, M. Chen, F. Xing, H. Chen, S. Xie. A simple photonic generation of linearly chirped microwave pulse with large time-bandwidth product and high compression ratio. Opt. Express, 21, 23107-23115(2013).
[10] W. Liang, V. Ilchenko, D. Eliyahu, A. Savchenkov, A. Matsko, D. Seidel, L. J. Maleki. Ultralow noise miniature external cavity semiconductor laser. Nat. Commun., 6, 7371(2015).
[11] R. Tkach, A. R. Chraplyvy. Regimes of feedback effects in 1.5-μm distributed feedback lasers. J. Lightwave Technol., 4, 1655-1661(1986).
[12] B. E. Little, S. T. Chu, H. A. Haus, J. Foresi, J.-P. Laine. Microring resonator channel dropping filters. J. Lightwave Technol., 15, 998-1005(1997).
[13] M. Yousefi, D. Lenstra, G. Vemuri, A. P. A. Fischer. Control of nonlinear dynamics of a semiconductor laser with filtered optical feedback. IEE Proc. Optoelectron., 148, 233-237(2001).
[14] M. Yousefi, D. Lenstra. Dynamical behavior of a semiconductor laser with filtered external optical feedback. IEEE J. Quantum Electron., 35, 970-976(1999).
[15] Y. Liu, P. Davis, Y. Takiguchi, T. Aida, S. Saito, J.-M. Liu. Injection locking and synchronization of periodic and chaotic signals in semiconductor lasers. IEEE J. Quantum Electron., 39, 269-278(2003).
[16] G. A. Acket, D. Lenstra, A. J. Denboef, B. H. Verbeek. The influence of feedback intensity on longitudinal mode properties and optical noise in index-guided semiconductor-lasers. IEEE J. Quantum Electron., 20, 1163-1169(1984).
[17] D. J. Blumenthal, R. Heideman, D. Geuzebroek, A. Leinse, C. Roeloffzen. Silicon nitride in silicon photonics. Proc. IEEE, 106, 2209-2231(2018).
[18] D. Althausen, D. Müller, A. Ansmann, U. Wandinger, H. Hube, E. Clauder, S. J. Zörner. Scanning 6-wavelength 11-channel aerosol lidar. J. Atmos. Ocean. Technol., 17, 1469-1482(2000).
[19] J. F. Bauters, M. J. Heck, D. John, D. Dai, M.-C. Tien, J. S. Barton, A. Leinse, R. G. Heideman, D. J. Blumenthal, J. E. Bowers. Ultra-low-loss high-aspect-ratio Si3N4 waveguides. Opt. Express, 19, 3163-3174(2011).
[20] L. Tang, Y. Li, J. Li, S. Yang, H. Chen, J. E. Chen. Temperature-insensitive Mach–Zehnder interferometer based on a silicon nitride waveguide platform. Opt. Express, 45, 2780-2783(2020).
[21] L. Tang, J. Li, S. Yang, H. Chen, M. Chen. A method for improving reflection tolerance of laser source in hybrid photonic packaged micro-system. IEEE Photonics Technol. Lett., 33, 465-468(2021).
[22] J. Li, B. Zhang, S. Yang, H. Chen, M. Chen. Robust hybrid laser linewidth reduction using Si3N4-based subwavelength hole defect assisted microring reflector. Photon. Res., 9, 558-566(2021).
[23] L. Chrostowski, M. Hochberg. Silicon Photonics Design: From Devices to Systems(2015).
[24] D. Huang, M. A. Tran, J. Guo, J. Peters, T. Komljenovic, A. Malik, P. A. Morton, J. E. Bowers. High-power sub-kHz linewidth lasers fully integrated on silicon. Optica, 6, 745-752(2019).
[25] L. Columbo, J. Bovington, S. Romero-Garcia, D. F. Siriani, M. Gioannini. Efficient and optical feedback tolerant hybrid laser design for silicon photonics applications. IEEE J. Sel. Top. Quantum Electron., 26, 8301210(2019).
[26] M. A. Tran, D. Huang, J. E. Bowers. Tutorial on narrow linewidth tunable semiconductor lasers using Si/III-V heterogeneous integration. APL Photonics, 4, 111101(2019).
[27] J. W. Dawson, N. Park, K. J. Vahala. An improved delayed self-heterodyne interferometer for linewidth measurements. IEEE Photonics Technol. Lett., 4, 1063-1066(1992).
[28] S. Camatel, V. Ferrero. Narrow linewidth CW laser phase noise characterization methods for coherent transmission system applications. J. Lightwave Technol., 26, 3048-3055(2008).
[29] L. B. Mercer. 1/f frequency noise effects on self-heterodyne linewidth measurements. J. Lightwave Technol., 9, 485-493(1991).
[30] P. Gallion, H. Nakajima, G. Debarge, C. Chabran. Contribution of spontaneous emission to the linewidth of an injection-locked semiconductor laser. Electron. Lett., 21, 626-628(1985).
[31] L. Stern, W. Zhang, L. Chang, J. Guo, C. Xiang, M. A. Tran, D. Huang, J. D. Peters, D. Kinghorn, J. E. Bowers. Ultra-precise optical-frequency stabilization with heterogeneous III–V/Si lasers. Opt. Lett., 45, 5275-5278(2020).
[32] L. Tang, S. Shao, S. Yang, H. Chen, M. Chen. Frequency modulated continuous wave narrow linewidth laser diode based on self-injection locking with external micro-ring resonator. European Conference of Integrated Optics (ECIO), 1-3(2020).
[33] M. Kamoun, R. K. Zadeh, Z. Zhao, G. Yang, H. Bao. Radio over fiber for cellular networks: system identification and pre-distortion strategies. IEEE Wireless Communications and Networking Conference (WCNC), 1-6(2019).
[34] H.-S. Ahn, Y. Chen, K. L. Moore. Iterative learning control: brief survey and categorization. IEEE Trans. Syst. Man Cybern. C, 37, 1099-1121(2007).
[35] M. Han, B. Mheen. High-resolution remote range detection method based on uncompensated FMCW sources for low-cost FMCW LIDAR. Proc. SPIE, 11525, 1152523(2020).
[36] A. Dieckmann. FMCW-LIDAR with tunable twin-guide laser diode. Electron. Lett., 30, 308-309(1994).
[37] S. O. Piper. FMCW linearizer bandwidth requirements. IEEE National Radar Conference, 142-146(1991).
[38] X. Fan, Y. Koshikiya, F. J. Ito. Phase-noise-compensated optical frequency domain reflectometry with measurement range beyond laser coherence length realized using concatenative reference method. Opt. Lett., 32, 3227-3229(2007).
[39] M. Liang, Q. Liu, W. Hu. 1550 nm monolithic MOPA diode laser for Lidar applications. Proc. SPIE, 11182, 1118207(2019).
[40] A. Martin, D. Dodane, L. Leviandier, D. Dolfi, A. Naughton, P. O’Brien, T. Spuessens, R. Baets, G. Lepage, J. Verheyen. Photonic integrated circuit-based FMCW coherent LiDAR. J. Lightwave Technol., 36, 4640-4645(2018).


Set citation alerts for the article
Please enter your email address

© Copyright 2018-2021 | Chinese Laser Press. All Rights Reserved 沪ICP备15018463号-20