• Opto-Electronic Advances
  • Vol. 3, Issue 5, 190034-1 (2020)
Fengze Tan1, Weimin Lyu1, Shuyang Chen1, Zhengyong Liu2, and Changyuan Yu1、*
Author Affiliations
  • 1Department of Electronic and Information Engineering, The Hong Kong Polytechnic University, Kowloon, Hong Kong, China
  • 2Department of Electrical Engineering, The Hong Kong Polytechnic University, Kowloon, Hong Kong, China
  • show less
    DOI: 10.29026/oea.2020.190034 Cite this Article
    Fengze Tan, Weimin Lyu, Shuyang Chen, Zhengyong Liu, Changyuan Yu. Contactless vital signs monitoring based on few-mode and multi-core fibers[J]. Opto-Electronic Advances, 2020, 3(5): 190034-1 Copy Citation Text show less
    The simulated intensity of excited LP01 mode and LP11 mode with offset distance between SMF and TMF from 0 μm to 10 μm (a) and the results of LP01, LP11, LP02 and LP21 modes regarding four-mode fiber (b).
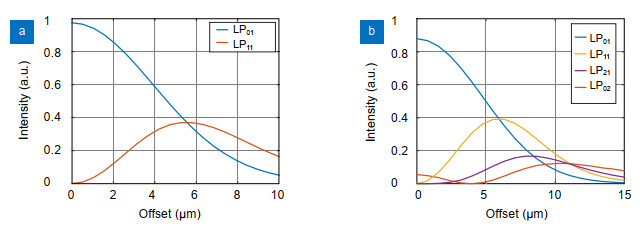
    Fig. 1. The simulated intensity of excited LP01 mode and LP11 mode with offset distance between SMF and TMF from 0 μm to 10 μm (a) and the results of LP01, LP11, LP02 and LP21 modes regarding four-mode fiber (b).
    The schematic diagram of FMF in-line interferometers based on the structure of SMF-FMF-SMF, and the intensity distribution of modes supported in FMF, namely LP01, LP11, LP02 and LP21 modes.
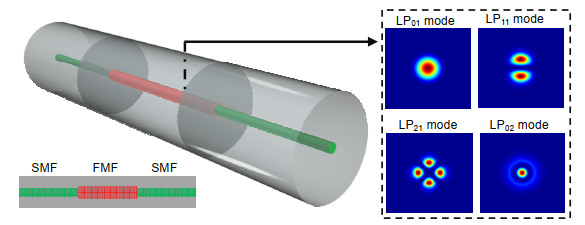
    Fig. 2. The schematic diagram of FMF in-line interferometers based on the structure of SMF-FMF-SMF, and the intensity distribution of modes supported in FMF, namely LP01, LP11, LP02 and LP21 modes.
    The experiment on ER versus offset distance between SMF and FMF to obtain a desired spectrum for sensing (a) and the results regarding TMF: collected spectra with the SMF shifts away from the TMF in transverse direction (b).
    Fig. 3. The experiment on ER versus offset distance between SMF and FMF to obtain a desired spectrum for sensing (a) and the results regarding TMF: collected spectra with the SMF shifts away from the TMF in transverse direction (b).
    Summarized extinction ratio as well as insertion loss variation when the SMF shifts away from the TMF in transverse direction (a) and the spectra under different lengths of TMF from 0.8 m to 0.4 m (b).
    Fig. 4. Summarized extinction ratio as well as insertion loss variation when the SMF shifts away from the TMF in transverse direction (a) and the spectra under different lengths of TMF from 0.8 m to 0.4 m (b).
    Collected optical spectra under different offset distances between SMF and four-mode fiber (a) and the summarized extinction ratio as well as insertion loss variation with offset distance (b).
    Fig. 5. Collected optical spectra under different offset distances between SMF and four-mode fiber (a) and the summarized extinction ratio as well as insertion loss variation with offset distance (b).
    Schematic diagrams of two MCF in-line interferometers: the TCF interferometer in the structure of SMF-TCF-SMF and the corresponding output optical spectrum (a), the SCF in-line interferometer based on the structure of SMF-MMF-SCF-MMF-SMF (b).
    Fig. 6. Schematic diagrams of two MCF in-line interferometers: the TCF interferometer in the structure of SMF-TCF-SMF and the corresponding output optical spectrum (a), the SCF in-line interferometer based on the structure of SMF-MMF-SCF-MMF-SMF (b).
    Optical spectra under different offset distances between SMF and TCF (a) and the desired spectrum obtained in the SCF in-line interferometer (b).
    Fig. 7. Optical spectra under different offset distances between SMF and TCF (a) and the desired spectrum obtained in the SCF in-line interferometer (b).
    Summarized extinction ratio as well as insertion loss variation when the SMF shifts away from the TCF in transverse direction (a) and the extinction ratio and insertion loss variation with different MMF lengths in SCF interferometer (b).
    Fig. 8. Summarized extinction ratio as well as insertion loss variation when the SMF shifts away from the TCF in transverse direction (a) and the extinction ratio and insertion loss variation with different MMF lengths in SCF interferometer (b).
    Vital signs monitoring experimental setup, including the in-line optical fiber interferometers based on FMF and MCF, which are placed under the mattress, a TLS for wavelength tuning and a photodetector as well as a DAQ card for data collection.
    Fig. 9. Vital signs monitoring experimental setup, including the in-line optical fiber interferometers based on FMF and MCF, which are placed under the mattress, a TLS for wavelength tuning and a photodetector as well as a DAQ card for data collection.
    Vital signs monitoring results using the TMF in-line interferometer, including the recovered respiration and heartbeat waveform, obtained RR (9 bpm) and HR (66 bpm) and interval errors (a), and the same results regarding the four-mode fiber interferometer (b).
    Fig. 10. Vital signs monitoring results using the TMF in-line interferometer, including the recovered respiration and heartbeat waveform, obtained RR (9 bpm) and HR (66 bpm) and interval errors (a), and the same results regarding the four-mode fiber interferometer (b).
    Vital signs monitoring results using the TCF interferometer, including the raw data, recovered respiration and heartbeat waveform for RR and HR calculation (a) and the respiration monitoring results using the SCF interferometer (b).
    Fig. 11. Vital signs monitoring results using the TCF interferometer, including the raw data, recovered respiration and heartbeat waveform for RR and HR calculation (a) and the respiration monitoring results using the SCF interferometer (b).
    Post-exercise physiological activities characterization results using the TCF in-line interferometer, including the recovered heartbeat waveform (a) and respiration waveform (b) and calculated HR and RR.
    Fig. 12. Post-exercise physiological activities characterization results using the TCF in-line interferometer, including the recovered heartbeat waveform (a) and respiration waveform (b) and calculated HR and RR.
    Curvature sensing results based on the TCF in-line interferometer: different sensitivities are observed under different bending direction from 0° to 360°, for example the wavelength shift results under the curvature from 0 m-1 to 1 m-1 indicates the sensitivity of 18 nm/m-1 under the orientation angle of 0°.
    Fig. 13. Curvature sensing results based on the TCF in-line interferometer: different sensitivities are observed under different bending direction from 0° to 360°, for example the wavelength shift results under the curvature from 0 m-1 to 1 m-1 indicates the sensitivity of 18 nm/m-1 under the orientation angle of 0°.
    Optical fiberComplexityExtinction ratioInsertion lossSensitivityVital signs signals
    Two-mode fiberLow12 dB-20 dBMediumHR and RR
    Four-mode fiberLow14 dB-25 dBMediumHR and RR
    Twin-core fiberMedium4 dB-25 dBHighHR and RR
    Seven-core fiberHigh4 dB-28 dBLowRR
    Table 1. Performance comparison of FMF and MCF on vital signs monitoring.
    Fengze Tan, Weimin Lyu, Shuyang Chen, Zhengyong Liu, Changyuan Yu. Contactless vital signs monitoring based on few-mode and multi-core fibers[J]. Opto-Electronic Advances, 2020, 3(5): 190034-1
    Download Citation