Abstract
Few-mode and multi-core fibers are proposed and demonstrated for contactless vital signs monitoring in this paper. In-line optical fiber interferometers using few-mode and multi-core fibers are designed and offset splicing is utilized for mode excitation. Extinction ratio and insertion loss are analyzed experimentally under different offset distances. The fabricated in-line interferometers are packaged under the mattress to realize contactless vital signs signals collection. By using filtering techniques, both respiration and heartbeat signals can be recovered successfully, and respiration as well as heartbeat ratio are obtained. Mode excitation and interference are theoretically analyzed in few-mode fiber while curvature sensing experiments using multi-core fiber interferometer are performed to verify its excellent performance on vital signs monitoring. The successful demonstration on contactless vital signs monitoring makes few-mode and multi-core fibers promising candidates for healthcare applications.Introduction
Vital signs, such as body temperature, respiration, heartbeat, blood pressure and pulse oxygenation, act as main health indicators of human body functions and the monitoring of vital signs becomes more and more important with the increasing concern on personal health condition among the public1. Good vital signs monitoring can not only assess daily personal health condition, but also help to diagnose specific diseases in early stage, like cardiovascular and cerebrovascular diseases2, 3. Among these vital signs, respiration and heartbeat are the most common indicators with their intuitive and close connection with health condition. According to the telehealth world market report, respiration and heartbeat related diseases account for as high as 49% and 12% respectively among chronic and senile diseases4. Thus, due to its remarkable importance, monitoring of respiration and heartbeat attracts concern in both research and industry area and many kinds of schemes have been proposed.
Among current techniques for respiration rate (RR) and heartbeat rate (HR) monitoring, one of the most widely investigated and employed is wearable device5. Various sensors and materials are explored, and excellent monitoring results are achieved. For example, for RR monitoring, conductive and dielectric materials are packaged between substrates and placed around the body, especially the chest area, in order to detect the chest volume change when breathing6. In addition, the temperature sensor placed near the nose with an acoustic sensor attached on the neck can realize accurate and detailed RR monitoring, including the whole process of oxygen inflowing and carbon dioxide removal7, 8. In general, technologies for RR monitoring are based on the expansion of chest and airflow change during breath. In contrast, technologies for HR monitoring vary, and electrical, optical and pressure signals are all employed. Electrocardiography (ECG) signal has been widely regarded as the golden standard for assessment on heart functions, such as HR, atrial fibrillation and ventricle function9, 10. It is physically based on the electrical signal detection from heart muscle when pumping blood. Conventional ECG devices require generally twelve leads attached on the body11 while current developed wearable ECG devices only need two leads1. Other than electrical sensors, optical and pressure sensors can also realize HR monitoring, and the technology employed is called plethysmography12, 13. Competitively, these wearable devices can realize stable HR and RR monitoring in any setting with long-term data collection. However, they inevitably require close contact or attachment with skin, which is not convenient and friendly for the elderly and children. In addition, for simultaneous HR and RR monitoring, more than one sensor or scheme has to be employed. Thus, contactless as well as simultaneous HR and RR monitoring technologies are desired and many schemes are also demonstrated. For example, wireless communication technologies are proposed for remote vital signs monitoring, including Wi-Fi14 and Doppler radar15. These systems are very complex and bulky since they are based on the communication setup and equipment. Compact monitoring systems are then proposed, such as near field coherent sensing, which only needs some lags on the wrist and chest16. Also, face recognition device and algorithm, called motion microscope, are proposed to detect small facial motion change due to blood flow to realize HR monitoring17. However, all the contactless vital signs monitoring technologies need to employ complex, high-cost and advanced algorithms, which is not appropriate for practical usage, especially in some low-resource settings. Thus, to achieve contactless and simultaneous HR and RR monitoring with low-cost and simple structures, other sensors are proposed, like electrical pressure sensors18. Commonly, these sensors are packaged as the cushion or mattress, which can also realize the sleep quality assessment19. Although some related technologies have been developed as products, they still cannot realize accurate and stable HR and RR monitoring due to their intrinsic drawback of low sensitivity. Optical fiber sensors, with excellent advantages of low-cost, compact, high sensitivity, immunity to electromagnetic interference, have been used for a wide range of applications, such as structural health monitoring, aerospace and railway performance monitoring20, 21. One piece of fiber sensor may replace thousands of electronic sensors. For vital signs monitoring, there are also some schemes proposed, namely the amplified bending loss sensors22 and optical fiber Mach-Zehnder interferometers23. RR detection is usually based on the pressure change on the fiber sensors while HR is obtained from the ballistocardiography (BCG) signal detection. BCG is the force or acceleration signal due to body movement in reaction to blood pumping from heartbeat to vasculatures24. For BCG signal detection, MZI shows better performance than optical fiber sensors using bending loss. However, its package is complex with two separated arms and the signal fading effect exists, which will degrade the monitoring performance. Therefore, in-line interferometers with single optical fiber and stable sensitivity will be preferred in sensor design for vital signs monitoring.
Spatial division multiplexing (SDM) technique is a novel multiplexing scheme proposed for future high-capacity optical fiber communication system and much attention has been drawn on SDM development, including transceiver and the specialty optical fibers design25, 26. Optical fibers utilized in SDM system are few-mode fiber (FMF) and multi-core fiber (MCF). They are designed to accommodate more than one mode and one core in single optical fiber as independent transmission channels so that the capacity can be improved exponentially. Other than communication systems, FMF and MCF are also proposed as desirable candidates in sensing community and many kinds of structures are demonstrated for various parameters measurement. For example, interferometers based on seven-core fiber (SCF) are proposed for high-temperature27 and strain sensing28 and heterogeneous SCF is also utilized in Brillouin distributed sensing system for simultaneous temperature and strain sensing29. For FMF, mode interference is investigated and many parameters measurement is achieved, such as temperature and strain30. In MCF and FMF, interference always happens among cores and modes, which can be utilized for sensing as in-line interferometers31. These interferometers own the advantages of easy-fabrication, low-cost, high sensitivity, stability and compact, which can be promising candidates for contactless vital signs monitoring32-34.
In this paper, FMF and MCF are proposed for contactless vital signs monitoring. The sensor structure is based on conventional single mode fiber-FMF/MCF-single mode fiber (SMF) in-line interferometers. For FMF, SMF is spliced on both ends with optimized distance. Two kinds of FMFs are investigated, including two-mode fiber (TMF) and four-mode fiber, and they are packaged as mattress under the bed to achieve contactless monitoring. Vital signs monitoring experiment is conducted and results show that both two kinds of FMF-based sensors can achieve simultaneous HR and RR monitoring with acceptable accuracy. Other than FMFs, MCFs are also employed, including twin-core fiber (TCF) and SCF. Corresponding in-line interferometers are also designed and fabricated, and the same packaging and following experiments show good vital signs monitoring results. In theory, beam propagation method is utilized for mode excitation simulation in FMF and curvature sensing is performed using TCF with achieved tunability as well as high sensitivity. In conclusion, based on FMF and MCF, both HR and RR can be monitored simultaneously in contactless way with acceptable accuracy and stable performance, which makes FMF and MCF promising candidates for vital signs monitoring in low-resource settings.
Operation principle
For the vital signs monitoring based on FMF in-line interferometers, the mode excitation and interference are utilized, which is discussed in this section. In FMF interferometers, the offset structure between SMF and FMF is usually utilized to excite higher order modes in the input end of FMF. This is due to the mode electrical field mismatch between fundamental mode in SMF and higher order modes in FMF. The mode excitation ratio calculation follows conventional overlap integral35, which can be expressed as follows:
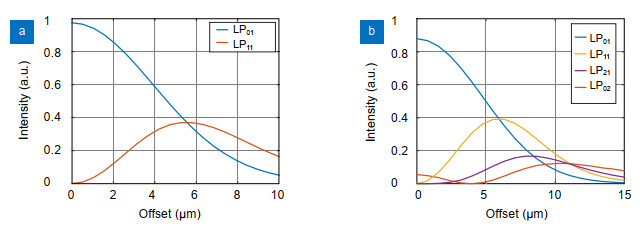
where Ii is the intensity distribution of input fiber mode and Ij corresponds to the excited mode. To discuss the offset impact on mode excitation theoretically, beam propagation method (BPM) is utilized. The models of FMF are established, including TMF and four-mode fiber, then offset distance between cores in SMF and FMF is tuned and the excitation results of every mode can be obtained from the monitor set on the output end of FMF. The results are shown in Fig. 1. It can be seen that for TMF as shown in Fig. 1(a), the LP01 mode intensity decreases with offset distance while LP11 mode intensity increases to the highest level under offset distance around 5.5 μm, and decreases until the interference disappears. The ER is dependent on the intensity ratio between two modes, and it can be concluded to reach the highest level when the power levels of two modes are identical. Thus, from the simulation results, the extinction ratio (ER) should increase firstly and then remain unchanged. For four-mode fiber, the results are shown in Fig. 1(b).

Figure 1.The simulated intensity of excited LP01 mode and LP11 mode with offset distance between SMF and TMF from 0 μm to 10 μm (a) and the results of LP01, LP11, LP02 and LP21 modes regarding four-mode fiber (b).
When modes are excited at the input end of FMF, they co-propagate along the fiber with different group velocities. Thus, at the end of FMF, the mode interference occurs, which is utilized for vital signs monitoring. The mode interference in FMF can be expressed as follows:
where M is the number of modes supported in FMF, k and l are the mode labels, τ is related to their group velocity difference and ϕ is the initial phase difference.
Vital signs monitors design and fabrication
Few-mode fiber in-line interferometers
The structure of FMF in-line interferometers is shown in Fig. 2. Traditional sandwich structure, SMF-FMF-SMF, is utilized and offset between SMF and FMF is used for mode excitation, especially higher order modes. Two kinds of FMFs are investigated, including TMF and four-mode fiber, which are both from OFS, Furukawa. FMF with enlarged core can support more than one mode in a single optical fiber. The modes supported in FMF, namely LP01, LP11, LP02 and LP21, are shown in Fig. 2.
Figure 2.The schematic diagram of FMF in-line interferometers based on the structure of SMF-FMF-SMF, and the intensity distribution of modes supported in FMF, namely LP01, LP11, LP02 and LP21 modes.
For mode excitation, due to the mode field mismatch between LP01 mode in SMF and higher order modes in FMF in offset structure, modes can be excited with different power ratios under different offset distances. As a result, the spectral ER changes with SMF shifts away from the FMF in center line.
Since the sensitivity of this FMF-based interferometer is directly determined by ER of optical spectrum, discussion on ER under different offset distances between SMF and FMF is performed experimentally. The experimental setup is shown in Fig. 3(a) and results of TMF are shown in Fig. 3(b). Broadband light source (BLS) ranging from 1550 nm to 1600 nm and optical spectrum analyzer (OSA, AQ6370D, Yokogawa) are utilized for optical spectrum monitoring. Two splicers (Fujikura FSM-100P, FSM-50s) are used for identical offset distance control between FMF and input/output SMF, as shown in the inset of Fig. 3(a). SMF and FMF are aligned firstly and the position of FMF on the holder is altered along downward direction as shown in Fig. 3(a). In the meantime, optical spectrum under every offset distance is collected. The results are shown in Fig. 3(b). It can be seen that with FMF away from SMF, the ER increases until the interference disappears due to high loss.
Figure 3.The experiment on ER versus offset distance between SMF and FMF to obtain a desired spectrum for sensing (a) and the results regarding TMF: collected spectra with the SMF shifts away from the TMF in transverse direction (b).
Based on the results in Fig. 3, ER as well as insertion loss variation with offset distance are obtained and summarized as Fig. 4(a). The ER increases firstly and remains unchanged while insertion loss increases with off-core distance. Apart from discussion on ER and insertion loss with offset distance, the spectral period under different lengths of TMF is considered. The results are shown in Fig. 4(b), in which the period increases proportionally with length from 0.8 m to 0.4 m. This trend agrees with the traditional theory about optical fiber interferometers. Based on the results above, considering spectral ER, insertion loss, the offset distance is confirmed with achieved ER around 12 dB and the loss of -20 dB. The length of TMF is around 1 m.
Figure 4.Summarized extinction ratio as well as insertion loss variation when the SMF shifts away from the TMF in transverse direction (a) and the spectra under different lengths of TMF from 0.8 m to 0.4 m (b).
Other than TMF, four-mode fiber is also utilized for in-line interferometer fabrication. The structure still follows Fig. 2, and experiments as well as corresponding discussion are also conducted in the same way. The optical spectra under different offset distances between SMF and four-mode fiber and the summarized ER and insertion loss results are shown in Fig. 5. Different from unique interference between LP01 mode and LP11 mode in TMF, more than one mode pair exists in four-mode fiber, which results in different trend of ER variation with offset distance. For example, the ER decreases initially to 2 dB with offset distance and then increases back to 20 dB with following decline to 10 dB. The inset shows the spectrum under ER of 2 dB, where the interference occurs with additional frequencies. Based on the results obtained, for four-mode fiber interferometer design, the achieved ER is 14 dB with insertion loss of -25 dB.
Figure 5.Collected optical spectra under different offset distances between SMF and four-mode fiber (a) and the summarized extinction ratio as well as insertion loss variation with offset distance (b).
Multi-core fiber in-line interferometers
Multi-core fiber, with more than one core in single optical fiber, can be also used for in-line interferometer design. Different from the mode interference in FMF, every core in MCF can interfere with each other, which is called core-mode interference. This core-mode interference exists in many kinds of MCFs. In this paper, SCF as well as TCF are explored. The TCF is homemade while SCF is from YOFC in China. The schematic diagrams of TCF and SCF in-line interferometers are shown in Fig. 6. Offset between TCF and SMF on both ends is also introduced as shown in Fig. 6(a). To fabricate this interferometer, in the input end, laser source operating in visible light is firstly utilized. Offset between SMF and TCF is tuned to make two cores in output end illuminated with the same power level, as shown in the inset. Then, the light source is replaced by BLS in the input end while OSA is utilized for output spectrum monitoring. The offset between TCF and output SMF is to achieve good interference result as shown in the inset in Fig. 6(a). For TCF, two cores in longitudinal direction can be treated as the sensing arm and the reference arm, which can be used to detect small pressure changes above. For SCF, the interference between center core-mode and outer core-modes is employed. As shown in Fig. 6(b), multi-mode fiber (MMF) is sandwiched between SMF and SCF to enlarge the optical field in order to excite all the cores in SCF. Also, the same MMF is used in the output end to collect the light into SMF.
Figure 6.Schematic diagrams of two MCF in-line interferometers: the TCF interferometer in the structure of SMF-TCF-SMF and the corresponding output optical spectrum (a), the SCF in-line interferometer based on the structure of SMF-MMF-SCF-MMF-SMF (b).
For the spectrum monitoring and dimension optimization of interferometers, the output spectra of TCF and SCF interferometers are shown in Fig. 7. Figure 7(a) shows the optical spectra under different offset distances in TCF interferometer and Fig. 7(b) is the output spectrum of SCF interferometer. To determine the offset distance between the SMF and TCF for a desired spectrum, the spectral ER and insertion loss under different offset distances between SMF and TCF are summarized in Fig. 8(a). The offset distance is determined to be around 6 μm and the ER can achieve 4 dB. For SCF interferometer in the structure of SMF-MMF-SCF-MMF-SMF, the length of MMF need optimization and the relationship between ER and MMF length is shown in Fig. 8(b). Then, the length of MMF is chosen to be around 5 mm with achieved ER of 4 dB.
Figure 7.Optical spectra under different offset distances between SMF and TCF (a) and the desired spectrum obtained in the SCF in-line interferometer (b).
Figure 8.Summarized extinction ratio as well as insertion loss variation when the SMF shifts away from the TCF in transverse direction (a) and the extinction ratio and insertion loss variation with different MMF lengths in SCF interferometer (b).
Vital signs monitoring experiments
Aforementioned in-line interferometers using FMF and MCF are proposed aiming to achieve contactless vital signs monitoring. Firstly, these interferometers are fabricated and packaged in the type of mat and then placed under the mattress to realize contactless monitoring. The vital signs signals, including respiration and heartbeat, introduce pressure and vibration changes on the sensing FMF and MCF. As a result, the optical spectrum shifts accordingly. In another way, under single-wavelength operation, the output optical intensity changes and the amplitude as well as frequency can be detected for later respiration and heartbeat signals extraction. The vital signs monitoring experimental setup is shown in Fig. 9. A tunable laser source (TLS) is used as the light source and a low-speed photodetector is utilized to convert optical signal to electrical signal so that the following data acquisition (DAQ) card can collect the signals with specific sampling rate. The sampling rate of DAQ card is 1 kHz. The computer is used for data collection and further processing. The subjects under test are selected in good health conditions with no history of pulmonary and heart diseases. During the experiment, the subjects lay on bed firstly and keep stable breath and heartbeat. Prior to data collection, the wavelength of laser source is tuned and an oscillation waveform can be observed, which corresponds to the optical spectrum essentially. Then, the wavelength is fixed to the center point of one rising edge in the spectrum to make sure the system works in the sensitive as well as quasi-linear region. As a result, the vital signs signals, including respiration and heartbeat, can be observed intuitively. For the experimental parameters, the lengths of both FMF and MCF are all around 1 m for the ease of packaging. The power of laser is around 0 dBm for FMF and MCF interferometers while the operation wavelengths are different in practice due to their different spectra. For FMF-based experiments, the TMF interferometer works under the wavelength of 1553.15 nm while four-mode fiber interferometer works under the wavelength of 1565.2 nm. For MCF interferometers, the wavelength is tuned to be 1560.2 nm and 1550.4 nm in TCF and SCF-based system, respectively. In fact, the vital signs monitoring system can also work with the same performance under other wavelengths considering the periodicity of the spectra shown above.
Figure 9.Vital signs monitoring experimental setup, including the in-line optical fiber interferometers based on FMF and MCF, which are placed under the mattress, a TLS for wavelength tuning and a photodetector as well as a DAQ card for data collection.
Results
Due to the intrinsic frequency difference of respiration and heartbeat, filtering technique is applied on the raw data to recover respiration and heartbeat signals, and HR and RR can be obtained eventually. Prior to vital signs signals extraction, noise is eliminated firstly. Then, based on the data with noise filtered out, a low-pass filter with cut-off frequency around 0.5 Hz is used to extract respiration signal. Then, a high-pass filter is applied on the data and heartbeat signal can be recovered. The cut-off frequency of high-pass filter is also set to 0.5 Hz. Due to the signal quality difference from FMF and MCF interferometers, the cut-off frequency may vary within an acceptable range. For the vital signs monitoring results, it is worth mentioned that, the rate change or system nonlinear functions will degrade the accuracy performance. For example, for patients who suffer from abnormal heartbeat activities, such as atrial fibrillation and arrhythmia, the HR accuracy obtained from the recovered heartbeat signal will be affected. On the other hand, when the system works under nonlinear conditions, such as the laser wavelength locating around dips or peaks in the optical spectrum, both the sensitivity and linearity will change due to the signal fading effect and the accuracy of RR and HR will be affected as a result.
Vital signs monitoring results using FMF interferometers
Following the filtering process introduced above, for FMF interferometers, the vital signs signals are recovered and corresponding HR as well as RR are obtained. The results are shown in Fig. 10. Figure 10(a) shows the recovered respiration and heartbeat signals using TMF interferometer while Fig. 10(b) shows the results regarding four-mode fiber.
Figure 10.Vital signs monitoring results using the TMF in-line interferometer, including the recovered respiration and heartbeat waveform, obtained RR (9 bpm) and HR (66 bpm) and interval errors (a), and the same results regarding the four-mode fiber interferometer (b).
To obtain HR and RR results, based on the recovered respiration and heartbeat signals, Fourier transform is applied. Then, according to the obtained peak frequency, HR and RR can be calculated in the unit of beats per minute (bpm). Furthermore, the intervals between peaks in recovered respiration and heartbeat signals are collected and summarized to get the error δ. For example, for breath signal of TMF within one minute, which locates at top left of Fig. 10(a). The RR calculated from Fourier transform results is 9 bpm and the breath interval error δ is 0.31 s. Similarly, for breath signal of four-mode fiber, the obtained RR is also 9 bpm and interval error δ is 0.72 s. The heartbeat results still follow the same analysis method and the results show that HR obtained from TMF and four-mode fiber are both 66 bpm and their heartbeat interval errors are 0.02 s and 0.08 s, respectively. It can be seen that, both HR and RR results locate in the normal range and the interval errors are small enough to guarantee the accuracy for HR and RR estimation, which demonstrates the feasibility of FMF and MCF in-line interferometers for simultaneous as well as accurate vital signs monitoring in the contactless manner.
Vital signs monitoring results using MCF interferometers
Following the same filtering techniques, the vital signs monitoring results using MCF in-line interferometers are shown in Fig. 11. Results regarding TCF interferometer are shown in Fig. 11(a) while the SCF-based results are in Fig. 11(b). For TCF, the upper diagram exhibits the raw data and the lower are the recovered respiration and heartbeat signals. Corresponding RR and HR can be estimated by calculating the intervals between peaks as shown in Fig. 11(a). The obtained HR and RR are 9 bpm and 80 bpm, respectively. For the SCF interferometer, the low-pass filtered waveform can be used for RR calculation as shown in Fig. 11(b) while the filtered heartbeat results fail to be utilized to calculate HR. This may due to the weak interference between center core-mode and outer core-modes under large core pitch size. It is worth noted here that, to discuss the feasibility of optical fiber interferometers for vital signs monitoring with different health conditions, for example the heartbeat condition, another subject is selected for vital signs monitoring experiments based on the MCF interferometers. This is the reason why the HR obtained is different from that of FMF interferometers. In summary, TCF interferometer shows excellent performance in both respiration and heartbeat signals monitoring while SCF interferometer can only detect the respiration signal. Other than static vital signs monitoring of subjects, the TCF in-line interferometer is also proposed for post-exercise physiological activities characterization in terms of HR and RR variation. During the experiments, the subject performs the burpee exercise for around 20 times within one minute to increase the HR and RR, and then lay on bed right after the exercise. The data are collected and the same processing method introduced above is utilized. The recovered respiration and heartbeat waveform as well as calculated HR and RR results are shown in Fig. 12. During the recovery process, it can be seen that the HR decreases from 100 bpm to 69 bpm as shown in Fig. 12(a) while the RR changes from 12 bpm to 9 bpm in Fig. 12(b) during the recover process. In addition, the amplitudes of both heartbeat and respiration also decrease accordingly. In conclusion, the post-exercise physiological activities characterization results demonstrate the feasibility of optical fiber in-line interferometers for vital signs monitoring in some extreme conditions.
Figure 11.Vital signs monitoring results using the TCF interferometer, including the raw data, recovered respiration and heartbeat waveform for RR and HR calculation (a) and the respiration monitoring results using the SCF interferometer (b).
Figure 12.Post-exercise physiological activities characterization results using the TCF in-line interferometer, including the recovered heartbeat waveform (a) and respiration waveform (b) and calculated HR and RR.
In summary, the performance of FMF and MCF on vital signs monitoring is compared in terms of complexity, extinction ratio, insertion loss, sensitivity and vital signs signals. The results are shown in Table 1.
| Optical fiber | Complexity | Extinction ratio | Insertion loss | Sensitivity | Vital signs signals |
| Two-mode fiber | Low | 12 dB | -20 dB | Medium | HR and RR |
| Four-mode fiber | Low | 14 dB | -25 dB | Medium | HR and RR |
| Twin-core fiber | Medium | 4 dB | -25 dB | High | HR and RR |
| Seven-core fiber | High | 4 dB | -28 dB | Low | RR |
Table 1. Performance comparison of FMF and MCF on vital signs monitoring.
Discussion
As demonstrated experimentally, TCF shows excellent performance on vital signs monitoring. To explore the reason as well as the basic measurand in it, curvature sensing experiments using TCF interferometer are conducted. The experimental setup follows the common one with two holders moving towards in steps for curvature variation on TCF. The curvature can be calculated from the distance between holders and the height of TCF pivot. The curvature sensing results are shown in Fig. 13.
Figure 13.Curvature sensing results based on the TCF in-line interferometer: different sensitivities are observed under different bending direction from 0° to 360°, for example the wavelength shift results under the curvature from 0 m-1 to 1 m-1 indicates the sensitivity of 18 nm/m-1 under the orientation angle of 0°.
The curvature sensing experiments are performed under different axial orientation angles of TCF, as shown in Fig. 13. For example, with orientation angle of 0°, meaning that the bending direction (red arrow) is along the twin-core direction, wavelength shift is recorded under curvature from 0 m-1 to 1 m-1. The achieved sensitivity under this orientation angle is as high as 18 nm/m-1. This may stand out among current curvature sensors. Then, TCF is rotated to 120° on both ends and the same curvature sensing experiment is conducted. In summary, with fiber twist angle of 0°, 120°, 240°, 360°, the sensitivity can achieve 18 nm/m-1, -7.5 nm/m-1, -13 nm/m-1, 18 nm/m-1, respectively. This sensitivity difference is introduced by the different length changes of arms in different orientations under identical curvature, which could be analyzed using the bending model36. Therefore, it can be concluded that, the high curvature sensitivity of TCF interferometer contributes to its excellent performance on vital signs monitoring.
Conclusions
In this paper, FMF and MCF based in-line interferometers are proposed for contactless vital signs monitoring, including HR and RR. FMF interferometer is designed with SMF sandwiched on both ends, and the offset between SMF and FMF is applied for mode excitation in order to form mode interference. Two kinds of FMF are investigated, including TMF and four-mode fiber, and optical spectra under different offset distances are collected. The dimension of interferometer is optimized considering the ER and insertion loss with offset distance. For MCF interferometers, TCF and SCF are utilized and desirable optical spectra are obtained for vital signs monitoring. FMF and MCF interferometers are packaged under the mattress to perform vital signs monitoring experiments. Filtering technique is applied on the collected raw data and reasonable cut-off frequencies are selected. For FMF, both respiration and heartbeat signals are recovered successfully, and HR and RR are obtained with acceptable accuracy. On the other hand, the TCF interferometer could realize HR and RR monitoring with best performance while the SCF-based can detect RR. Theoretically, mode excitation and interference are simulated in FMF, the results of which agree well with the experiment. Curvature sensing experiment is conducted using TCF interferometer and the achieved high sensitivity supports its excellent vital signs monitoring performance. In conclusion, FMF and MCF for contactless vital signs monitoring are demonstrated successfully, which shows their potentials on future healthcare applications.
Acknowledgements
We are grateful for financial supports from The Hong Kong Polytechnic University (1-ZVHA and 1-ZVGB) and HK GRC GRF (15211317).
Competing interests
The authors declare no competing financial interests.
References
[1] Y Khan, A E Ostfeld, C M Lochner, A Pierre, A C Arias. Monitoring of vital signs with flexible and wearable medical devices. Adv Mater, 28, 4373-4395(2016).
[2] S Y Tsai, C H Lee, P H Chen, K H Chung, S H Huang et al. Risk factors for early cardiovascular mortality in patients with bipolar disorder. Psychiatry Clin Neurosci, 71, 716-724(2017).
[3] R A Wise, K R Chapman, B M Scirica, D A Schoenfeld, D L Bhatt et al. Long-term evaluation of the effects of aclidinium bromide on major adverse cardiovascular events and COPD exacerbations in patients with moderate to very severe COPD: rationale and design of the ASCENT COPD study. Chronic Obstr Pulm Dis, 5, 5-15(2018).
[4] F X Zhang, Y Yu, J Zhong. Research status and development prospects of human vital signs monitoring clothing. IOP Conf Se Earth Environ Sci, 233, 042031(2019).
[5] Z H Wang, Z C Yang, T Dong. A review of wearable technologies for elderly care that can accurately track indoor position, recognize physical activities and monitor vital signs in real time. Sensors (Basel), 17, 341(2017).
[6] P Guay, S Gorgutsa, S LaRochelle, Y Messaddeq. Wearable contactless respiration sensor based on multi-material fibers integrated into textile. Sensors (Basel), 17, 1050(2017).
[7] P Corbishley, E Rodriguez-Villegas. Breathing detection: towards a miniaturized, wearable, battery-operated monitoring system. IEEE Trans Biomed Eng, 55, 196-204(2008).
[8] O Mimoz, T Benard, A Gaucher, D Frasca, B Debaene. Accuracy of respiratory rate monitoring using a non-invasive acoustic method after general anaesthesia. Br J Anaesth, 108, 872-875(2012).
[9] B Pourbabaee, M J Roshtkhari, K Khorasani. Deep convolutional neural networks and learning ECG features for screening paroxysmal atrial fibrillation patients. IEEE Trans Syst Man Cybern Syst, 48, 2095-2104(2018).
[10] E L Vu, C G Rusin, D J Penny, K K Kibler, R B Easley et al. A novel electrocardiogram algorithm utilizing st-segment instability for detection of cardiopulmonary arrest in single ventricle physiology: a retrospective study. Pediatr Crit Care Med, 18, 44-53(2017).
[11] Z C Haberman, R T Jahn, R Bose, H Tun, J S Shinbane et al. Wireless smartphone ECG enables large-scale screening in diverse populations. J Cardiovasc Electrophysiol, 26, 520-526(2015).
[12] C M Lochner, Y Khan, A Pierre, A C Arias. All-organic optoelectronic sensor for pulse oximetry. Nat Commun, 5, 5745(2014).
[13] J Harju, A Tarniceriu, J Parak, A Vehkaoja, A Yli-Hankala et al. Monitoring of heart rate and inter-beat intervals with wrist plethysmography in patients with atrial fibrillation. Physiol Meas, 39, 065007(2018).
[14] J Liu, Y Y Chen, Y Wang, X Chen, J Cheng et al. Monitoring vital signs and postures during sleep using wifi signals. IEEE Internet Things J, 5, 2071-2084(2018).
[15] M Nosrati, S Shahsavari, S Lee, H Wang, N Tavassolian. A concurrent dual-beam phased-array doppler radar using MIMO beamforming techniques for short-range vital-signs monitoring. IEEE Trans Antennas Propag, 67, 2390-2404(2019).
[16] X N Hui, E C Kan. Monitoring vital signs over multiplexed radio by near-field coherent sensing. Nat Electron, 1, 74-78(2018).
[17] N Wadhwa, J G Chen, J B Sellon, D L Wei, M Rubinstein et al. Motion microscopy for visualizing and quantifying small motions. Proc Natl Acad Sci USA, 114, 11639-11644(2017).
[18] X L Chen, J Y Shao, N L An, X M Li, H M Tian et al. Self-powered flexible pressure sensors with vertically well-aligned piezoelectric nanowire arrays for monitoring vital signs. J Mater Chem C, 3, 11806-11814(2015).
[19] I Sadek, E Seet, J Biswas, B Abdulrazak, M Mokhtari. Nonintrusive vital signs monitoring for sleep apnea patients: a preliminary study. IEEE Access, 6, 2506-2514(2018).
[20] I Garcia, J Zubia, G Durana, G Aldabaldetreku, M A Illarramendi et al. Optical fiber sensors for aircraft structural health monitoring. Sensors (Basel), 15, 15494-15519(2015).
[21] A Barrias, J R Casas, S Villalba. A review of distributed optical fiber sensors for civil engineering applications. Sensors, 16, 748(2016).
[22] X F Yang, Z H Chen, C S M Elvin, L H Y Janice, S H Ng et al. Textile fiber optic microbend sensor used for heartbeat and respiration monitoring. IEEE Sens J, 15, 757-761(2015).
[23] C Y Yu, W Xu, N Zhang, C C Yu et al. Non-invasive smart health monitoring system based on optical fiber interferometers. In Proceedings of the 2017 16th International Conference on Optical Communications and Networks 1–3 (IEEE, 2017)(2017).
[24] O T Inan, P F Migeotte, K S Park, M Etemadi, K Tavakolian et al. Ballistocardiography and seismocardiography: a review of recent advances. IEEE J Biomed Health Inform, 19, 1414-1427(2015).
[25] G F Li, N Bai, N B Zhao, C Xia. Space-division multiplexing: the next frontier in optical communication. Adv Opt Photonics, 6, 413-487(2014).
[26] G Rademacher, R Ryf, N K Fontaine, H S Chen, R J Essiambre et al. Long-haul transmission over few-mode fibers with space-division multiplexing. J Lightw Technol, 36, 1382-1388(2018).
[27] A Van Newkirk, E Antonio-Lopez, G Salceda-Delgado, R Amezcua-Correa, A Schülzgen. Optimization of multicore fiber for high-temperature sensing. Opt Lett, 39, 4812-4815(2014).
[28] J Villatoro, O Arrizabalaga, G Durana, I Saez de Ocariz, E Antonio-Lopez et al. Accurate strain sensing based on super-mode interference in strongly coupled multi-core optical fibres. Sci Rep, 7, 4451(2017).
[29] Z Y Zhao, Y L Dang, M Tang, B R Li, L Gan et al. Spatial-division multiplexed Brillouin distributed sensing based on a heterogeneous multicore fiber. Opt Lett, 42, 171-174(2017).
[30] A Li, Y F Wang, J Fang, M J Li, B Y Kim et al. Few-mode fiber multi-parameter sensor with distributed temperature and strain discrimination. Opt Lett, 40, 1488-1491(2015).
[31] Z Y Zhao, M Tang, S N Fu, S Liu, H F Wei et al. All-solid multi-core fiber-based multipath Mach-Zehnder interferometer for temperature sensing. Appl Phys B, 112, 491-497(2013).
[32] S Y Chen, Z Y Huang, F Z Tan, T Y Yang, J J Tu et al. Vital signs monitoring using few-mode fiber-based sensors. Proc SPIE, 10814, 108140P(2018).
[33] S Y Chen, F Z Tan, Z Y Huang, T Y Yang, J J Tu. Non-invasive smart monitoring system based on multi-core fiber optic interferometers. In Proceedings of 2018 Asia Communications and Photonics Conference 1–3 (IEEE, 2018)(2018).
[34] F Z Tan, Z Y Liu, S Y Chen, C Y Yu. Vital signs monitoring using twin core fiber-based sensor. In Proceedings of the 2019 24th OptoElectronics and Communications Conference (OECC) and 2019 International Conference on Photonics in Switching and Computing (PSC) (IEEE, 2019)(2019).
[35] Y Weng, E Ip, Z Q Pan, T Wang. Single-end simultaneous temperature and strain sensing techniques based on Brillouin optical time domain reflectometry in few-mode fibers. Opt Express, 23, 9024-9039(2015).
[36] G L Yin, S Q Lou, W L Lu, X Wang. A high-sensitive fiber curvature sensor using twin core fiber-based filter. Appl Phys B, 115, 99-104(2014).