Dinusha Serandi Gunawardena, Xin Cheng, Jingxian Cui, Geraldi Edbert, Linyue Lu, Yuk Ting Ho, Hwa-Yaw Tam, "Regenerated polymer optical fiber Bragg gratings with thermal treatment for high temperature measurements," Photonics Res. 10, 1011 (2022)

Search by keywords or author
- Photonics Research
- Vol. 10, Issue 4, 1011 (2022)

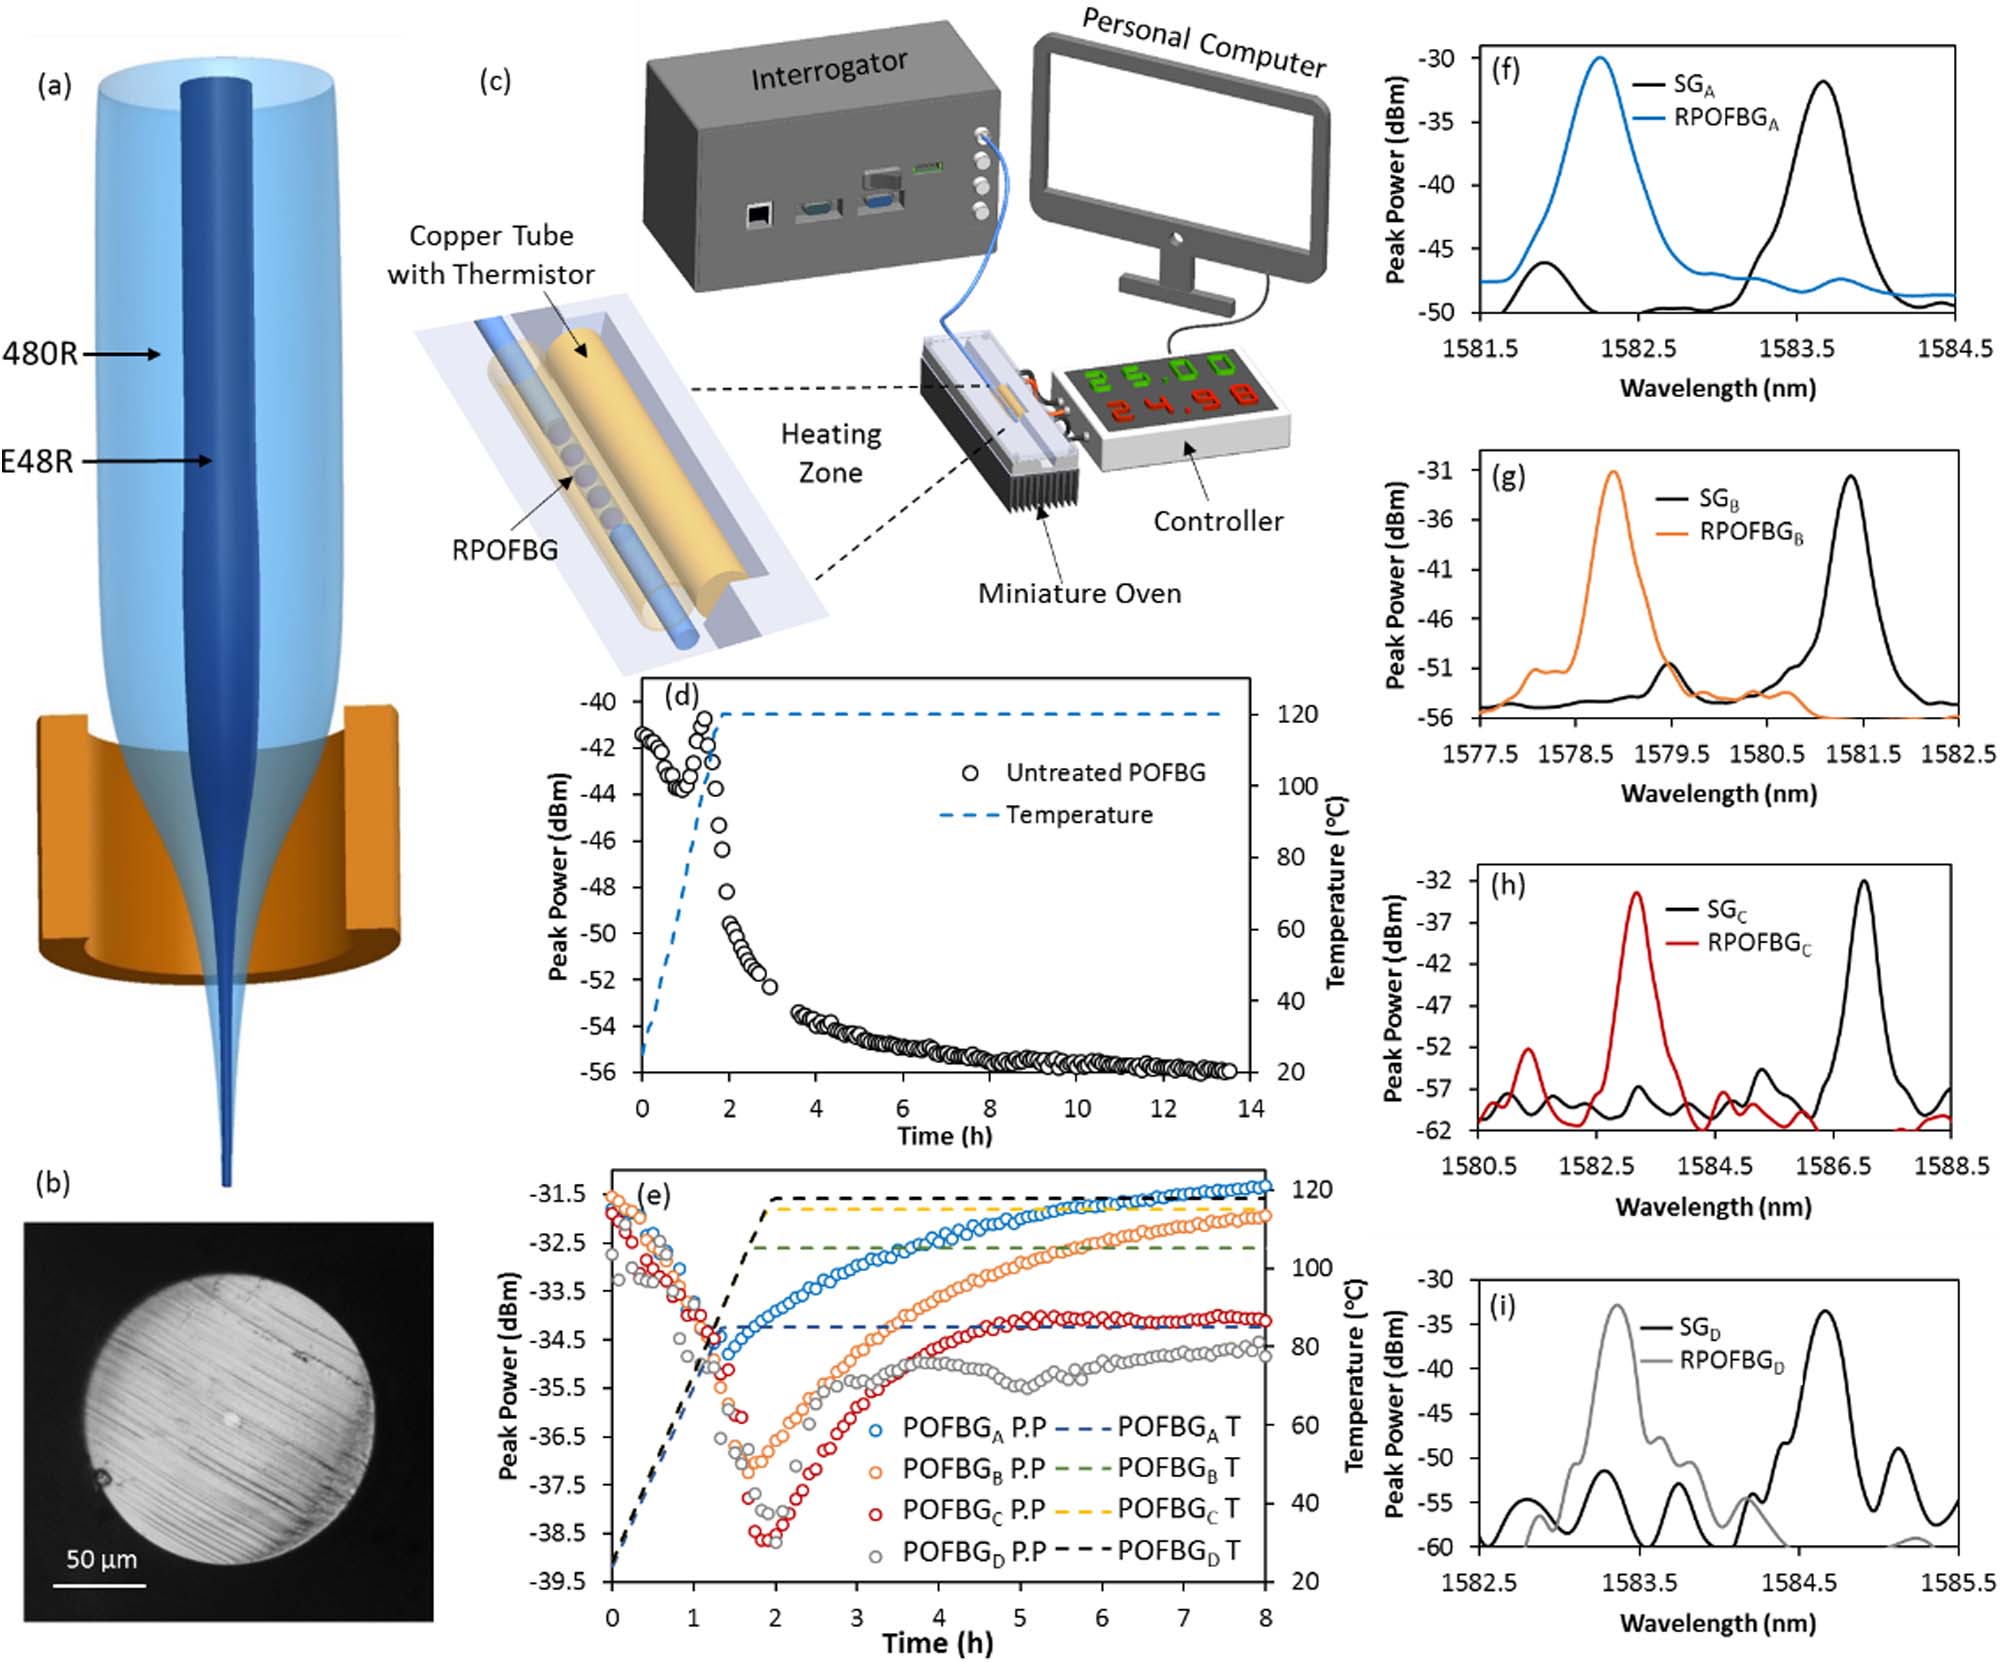
Fig. 1. (a) Schematic illustration of core and cladding compositions and (b) cross-sectional microscopic image of ZEONEX-based POF. (c) Experimental configuration of the thermal annealing setup; evolution of reflected peak power of POFBGs during thermal regeneration inscribed in (d) untreated and (e) thermally treated ZEONEX-based POFs. Reflection spectral profiles of SG A − D and RPOFBG A − D in ZEONEX-based POFs at room temperature that underwent thermal treatment at (f) 85°C, (g) 105°C, (h) 115°C, and (i) 128°C.

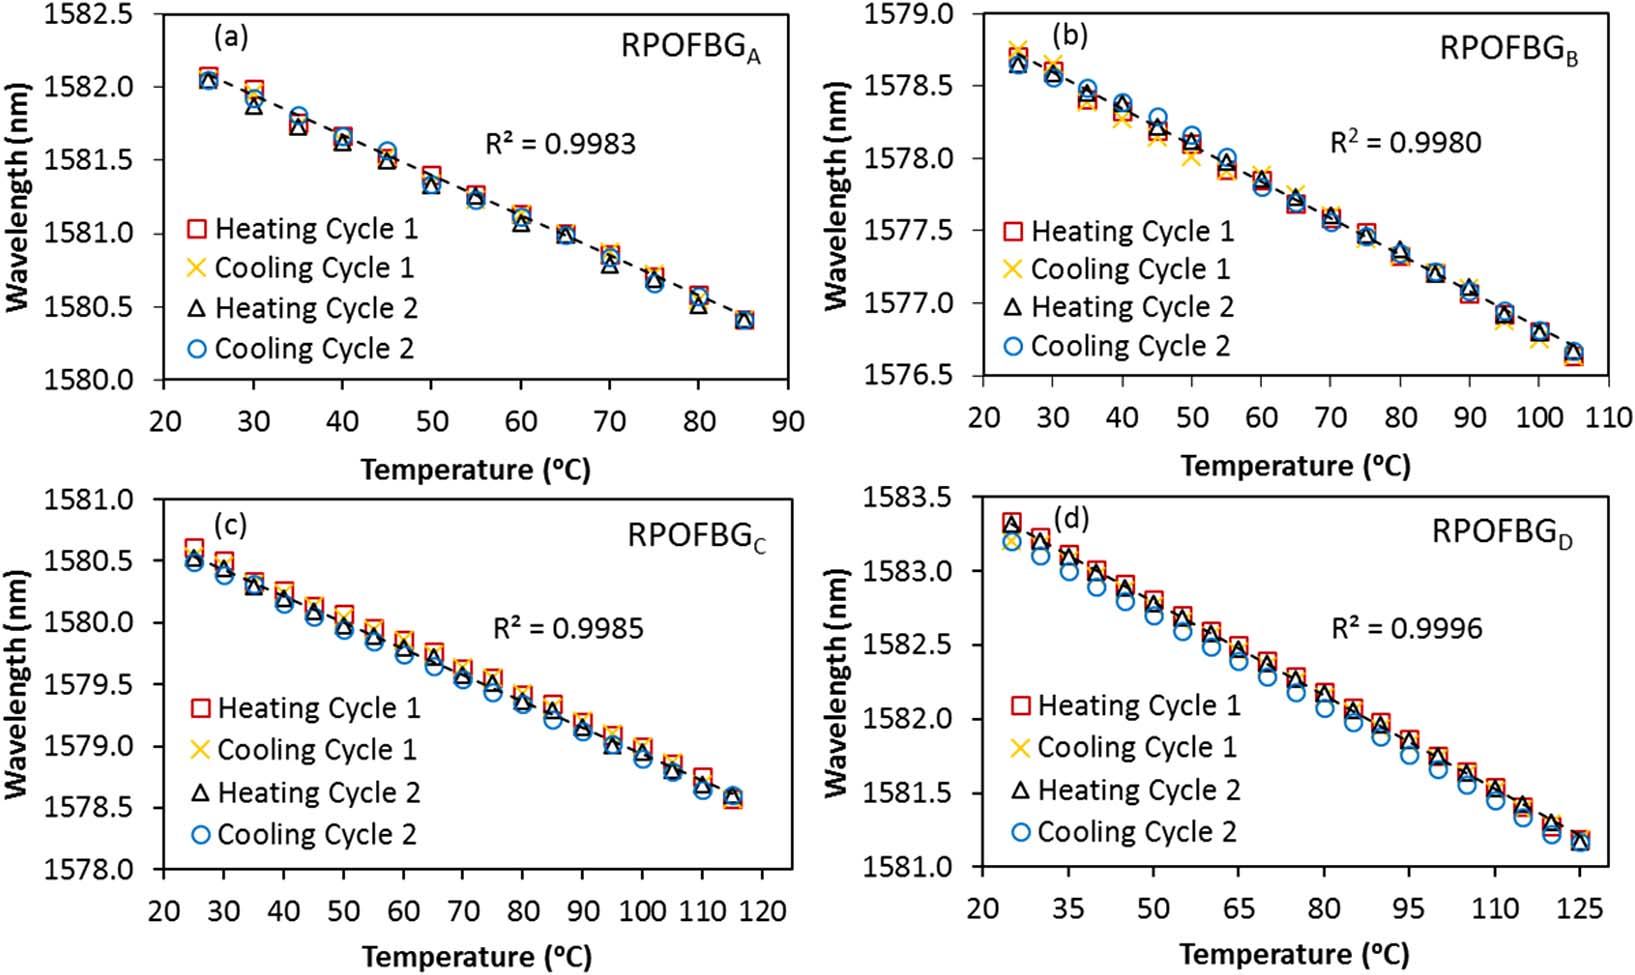
Fig. 2. Temperature measurements for two heating and cooling cycles each: (a) RPOFBG A from 25°C to 85°C, (b) RPOFBG B from 25°C to 105°C, (c) RPOFBG C from 25°C to 115°C, and (d) RPOFBG D from 25°C to 125°C.

Fig. 3. (a) Normalized Bragg wavelength and (b) peak power stability of RPOFBG A − D during stepwise heating and cooling processes from 25°C to respective regeneration temperatures. Temperature ramping rate is 1°C/min with a dwell time of 2 h at each step. (c) Bragg wavelength shift and (d) corresponding variation in reflected peak power of RPOFBG D at 110°C over 7 h. (e) Bragg wavelength shifts of RPOFBG D during three stepwise heating and cooling cycles from 25°C to 121°C and (f) reflection spectrum profiles corresponding to each step, denoted as a–g. (g) Bragg wavelength shift of RPOFBG D during a single heating and cooling cycle from 25°C to 132°C, and (h) reflection spectrum profiles corresponding to each step, denoted as a–c. Temperature ramping rate is 2°C/min with dwell times of 30 min and 4 min at 121°C and 132°C, respectively.

Fig. 4. (a) Temperature sensitivity calibration for two cooling and heating cycles from 24°C to 2°C, (b) wavelength shift with increasing temperature, and (c) corresponding reflection spectrum profiles of RPOFBG D from 133°C to 137°C. The temperature ramping rate is 1°C/min.

Fig. 5. Configuration of the experimental setup used for strain calibrations.

Fig. 6. Strain sensitivity calibrations for two loading and unloading cycles: (a) RPOFBG A at 25°C and (b) at 75°C; (c) RPOFBG B at 25°C and (d) at 95°C; (e) RPOFBG C at 25°C and (f) at 105°C; and (g) RPOFBG D at 25°C and (h) at 110°C. Reflection spectrum profiles of RPOFBG D at ambient temperature during (i) loading and (j) unloading cycles and at 110°C during (k) loading and (l) unloading cycles.

Fig. 7. Raman spectra of ZEONEX material in the core (E48R) from (a) 250 to 1600 cm − 1 and (b) 2600 to 3100 cm − 1 and cladding (480R) from (c) 250 to 1600 cm − 1 and (d) 2600 to 3100 cm − 1 . Anticipated vibrational mode ranges are denoted. Confocal maps of an unannealed fiber cross section corresponding to Raman peaks at (e) 771 cm − 1 , (f) 1483 cm − 1 , and (g) 2963 cm − 1 . Inset in (b) indicates the chemical structure of ZEONEX cyclo olefin polymer.

Fig. 8. Comparison of Raman spectra between UV irradiated and regenerated fiber cross sections in the core from (a) 700 to 1600 cm − 1 (inset shows an enlarged view of the peaks corresponding to C-C stretching vibrations) and (b) 2600 to 3100 cm − 1 , and in the cladding from (c) 700 to 1600 cm − 1 (inset shows an enlarged view of the peaks corresponding to CH 2 bending and rocking vibrations) and (d) 2600 to 3100 cm − 1 . (e) Raman spectra of continuous points from center of the regenerated fiber core to the inner cladding up to 9 μm in steps of 1 μm. Center of the core is referred to as the 0 μm position. The dashed line denotes the shift of the Raman peak.
|
Table 1. Thermal History of the Fabricated RPOFBGs
|
Table 2. Thermal Stability of POFBGs in Different Types of POFs

Set citation alerts for the article
Please enter your email address