• Matter and Radiation at Extremes
  • Vol. 5, Issue 6, 064202 (2020)
F. B. Rosmej1、2、3、4、a), L. A. Vainshtein5, V. A. Astapenko3, and V. S. Lisitsa3、4、6
Author Affiliations
  • 1Sorbonne University, Faculty of Science and Engineering, UMR 7605, case 128, 4 Place Jussieu, F-75252 Paris Cedex 05, France
  • 2LULI, Ecole Polytechnique, CNRS-CEA, Physique Atomique dans les Plasmas Denses (PAPD), Route de Saclay, F-91128 Palaiseau Cedex, France
  • 3Moscow Institute of Physics and Technology MIPT (National Research University), Dolgoprudnyi 141700, Russia
  • 4National Research Nuclear University—MEPhI, Department of Plasma Physics, Moscow 115409, Russia
  • 5P. N. Lebedev Physical Institute of the Russian Academy of Sciences, Moscow 119991, Russia
  • 6National Research Center “Kurchatov Institute”, Moscow, Russia
  • show less
    DOI: 10.1063/5.0022751 Cite this Article
    F. B. Rosmej, L. A. Vainshtein, V. A. Astapenko, V. S. Lisitsa. Statistical and quantum photoionization cross sections in plasmas: Analytical approaches for any configurations including inner shells[J]. Matter and Radiation at Extremes, 2020, 5(6): 064202 Copy Citation Text show less
    The Sommerfeld, Kramers, and Born cross-sections for photoionization of the ground state of a hydrogen atom and the cross-section in the Rost approximation vs the photon energy. The cross-sections are in units of Å2 = 10−16 cm2.
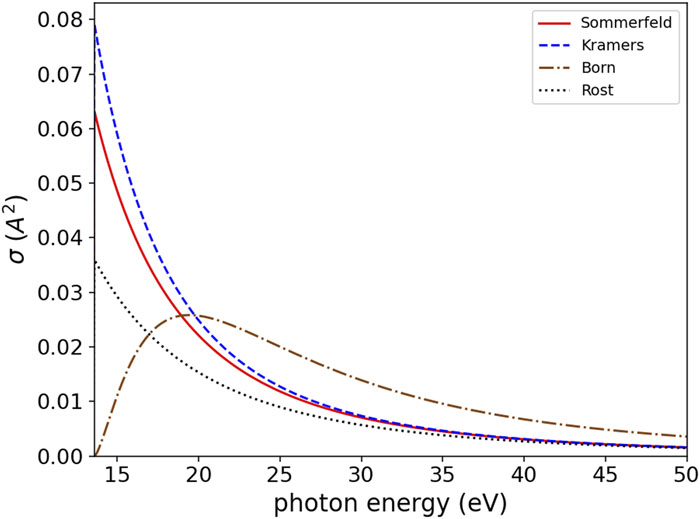
    Fig. 1. The Sommerfeld, Kramers, and Born cross-sections for photoionization of the ground state of a hydrogen atom and the cross-section in the Rost approximation vs the photon energy. The cross-sections are in units of Å2 = 10−16 cm2.
    Photoionization cross-section (units of Mb = 10−21 cm2) of a krypton atom vs photon energy: the solid red curve is for the standard hydrogen-like approximation and the dotted blue curve is for the local plasma model with electron density according to the Thomas–Fermi model.
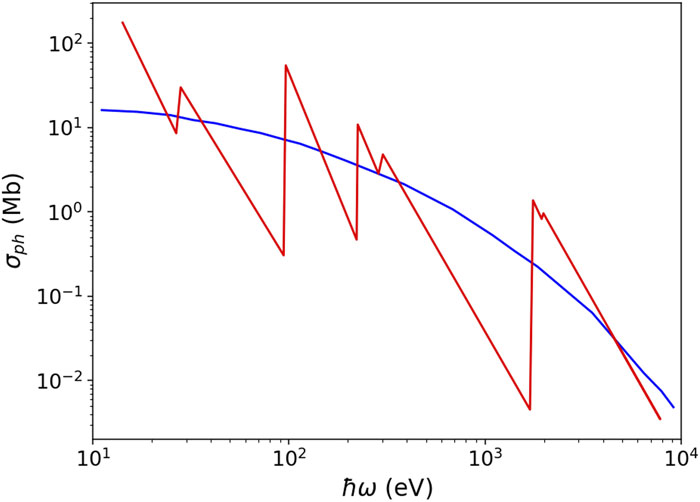
    Fig. 2. Photoionization cross-section (units of Mb = 10−21 cm2) of a krypton atom vs photon energy: the solid red curve is for the standard hydrogen-like approximation and the dotted blue curve is for the local plasma model with electron density according to the Thomas–Fermi model.
    Photoionization cross-sections in the Brandt–Lundqvist approximation employing different statistical atomic models: (1) Thomas–Fermi; (2) Lenz–Jensen; (3) exponential screening. Cross-sections in units of Mb = 10−21 cm2 are plotted vs the scaled photon energy.
    Fig. 3. Photoionization cross-sections in the Brandt–Lundqvist approximation employing different statistical atomic models: (1) Thomas–Fermi; (2) Lenz–Jensen; (3) exponential screening. Cross-sections in units of Mb = 10−21 cm2 are plotted vs the scaled photon energy.
    Comparison of photoionization cross-sections vs photon energy obtained from the quantum mechanical numerical results of the ATOM code with the generalized scaled formulas of Eqs. (4.1)–(4.6) for H-like neon and the 4s, 4p, 4d, and 4f states. The energy at threshold is 85 eV.
    Fig. 4. Comparison of photoionization cross-sections vs photon energy obtained from the quantum mechanical numerical results of the ATOM code with the generalized scaled formulas of Eqs. (4.1)(4.6) for H-like neon and the 4s, 4p, 4d, and 4f states. The energy at threshold is 85 eV.
    Comparison of photoionization cross-sections vs photon energy obtained from the quantum mechanical numerical results of the ATOM code with the GSPM [Eqs. (4.1)–(4.6)] for the photoionization cross-section of the B-like neon ground state. The energy at threshold is 158 eV.
    Fig. 5. Comparison of photoionization cross-sections vs photon energy obtained from the quantum mechanical numerical results of the ATOM code with the GSPM [Eqs. (4.1)(4.6)] for the photoionization cross-section of the B-like neon ground state. The energy at threshold is 158 eV.
    Comparison of photoionization cross-sections vs photon energy obtained from the quantum mechanical numerical results of the ATOM code with the present GSPM [Eqs. (4.1)–(4.6)] for the photoionization cross-section of the B-like neon from the inner shell 1s. The energy at threshold is 1051 eV.
    Fig. 6. Comparison of photoionization cross-sections vs photon energy obtained from the quantum mechanical numerical results of the ATOM code with the present GSPM [Eqs. (4.1)(4.6)] for the photoionization cross-section of the B-like neon from the inner shell 1s. The energy at threshold is 1051 eV.
    Comparison of photoionization cross-sections vs photon energy obtained from the quantum mechanical numerical results of the ATOM code with the present GSPM [Eqs. (4.1)–(4.6)] for the photoionization cross-section of the ground state of neutral neon. The energy at threshold is 21.6 eV.
    Fig. 7. Comparison of photoionization cross-sections vs photon energy obtained from the quantum mechanical numerical results of the ATOM code with the present GSPM [Eqs. (4.1)(4.6)] for the photoionization cross-section of the ground state of neutral neon. The energy at threshold is 21.6 eV.
    Photoionization cross-section vs photon energy for neutral helium in the ground state 1s21S0 (the energy threshold is at 24.58 eV). Comparison with the reference data from Ref. 30 shows very good agreement with our quantum mechanical numerical results obtained from the ATOM code and with the GSPM [Eqs. (4.1)–(4.6)]. The experimental data from Ref. 31 show rather large deviations in the high-energy region.
    Fig. 8. Photoionization cross-section vs photon energy for neutral helium in the ground state 1s21S0 (the energy threshold is at 24.58 eV). Comparison with the reference data from Ref. 30 shows very good agreement with our quantum mechanical numerical results obtained from the ATOM code and with the GSPM [Eqs. (4.1)(4.6)]. The experimental data from Ref. 31 show rather large deviations in the high-energy region.
    Comparison of the photoionization cross-sections vs photon energy for neutral helium in the ground state 1s21S0 calculated with different methods: reference data from Ref. 30 (solid green curve), the present GSPM (solid black curve), the standard H-like model with Zeff=Z̃ (solid red curve), and the local plasma frequency approach employing the Thomas–Fermi atomic model (solid blue curve).
    Fig. 9. Comparison of the photoionization cross-sections vs photon energy for neutral helium in the ground state 1s21S0 calculated with different methods: reference data from Ref. 30 (solid green curve), the present GSPM (solid black curve), the standard H-like model with Zeff=Z̃ (solid red curve), and the local plasma frequency approach employing the Thomas–Fermi atomic model (solid blue curve).
    Comparison of photoionization cross-sections vs photon energy for neutral neon in the ground state 1s22s22p61S0 calculated with different methods: experimental data from Ref. 31 (solid green squares); the present GSPM (solid black curve); the standard H-like model with Zeff=Z̃ (solid red curve); and the local plasma frequency approach employing the Thomas–Fermi atomic model (solid blue curve), the Sommerfeld analytical Thomas–Fermi model (dashed blue curve), the Lenz–Jensen model (solid purple curve), and the numerical Hartree–Fock atomic densities (solid yellow curve).
    Fig. 10. Comparison of photoionization cross-sections vs photon energy for neutral neon in the ground state 1s22s22p61S0 calculated with different methods: experimental data from Ref. 31 (solid green squares); the present GSPM (solid black curve); the standard H-like model with Zeff=Z̃ (solid red curve); and the local plasma frequency approach employing the Thomas–Fermi atomic model (solid blue curve), the Sommerfeld analytical Thomas–Fermi model (dashed blue curve), the Lenz–Jensen model (solid purple curve), and the numerical Hartree–Fock atomic densities (solid yellow curve).
    Comparison of photoionization cross-sections vs photon energy for neutral argon in the ground state 1s22s22p63s23p61S0 calculated with different methods: experimental data from Ref. 31 (solid green squares); the present GSPM (solid black curve); the standard H-like model with Zeff=Z̃ (solid red curve); and the local plasma frequency approach employing the Thomas–Fermi atomic model (solid blue curve), the Sommerfeld analytical Thomas–Fermi model (dashed blue curve), the Lenz–Jensen model (solid purple curve), and the numerical Hartree–Fock atomic densities (solid yellow curve).
    Fig. 11. Comparison of photoionization cross-sections vs photon energy for neutral argon in the ground state 1s22s22p63s23p61S0 calculated with different methods: experimental data from Ref. 31 (solid green squares); the present GSPM (solid black curve); the standard H-like model with Zeff=Z̃ (solid red curve); and the local plasma frequency approach employing the Thomas–Fermi atomic model (solid blue curve), the Sommerfeld analytical Thomas–Fermi model (dashed blue curve), the Lenz–Jensen model (solid purple curve), and the numerical Hartree–Fock atomic densities (solid yellow curve).
    Atomic electron densities vs radius for neutral krypton in the ground state 1s22s22p63s23p63d104s24p61S0 calculated within the framework of the Hartree–Fock method20 (solid black curve), the Thomas–Fermi model (solid red curve), and the Lenz–Jensen model (solid blue curve). The right-hand scale indicates the plasma frequency associated with the atomic electron density.
    Fig. 12. Atomic electron densities vs radius for neutral krypton in the ground state 1s22s22p63s23p63d104s24p61S0 calculated within the framework of the Hartree–Fock method20 (solid black curve), the Thomas–Fermi model (solid red curve), and the Lenz–Jensen model (solid blue curve). The right-hand scale indicates the plasma frequency associated with the atomic electron density.
    Radial wavefunction densities Nnl⋅Pnl(r)2 vs radius for neutral krypton in the ground state 1s22s22p63s23p63d104s24p61S0 calculated within the framework of the Hartree–Fock method:20 total electron density (black solid curve); s wavefunctions (other solid curves); p wavefunctions (dashed curves); d wavefunctions (dotted curves). Principal quantum numbers are designated by different colors: K shell (red curve); L shell (blue curves); M shell (green curves); N shell (purple curves).
    Fig. 13. Radial wavefunction densities NnlPnl(r)2 vs radius for neutral krypton in the ground state 1s22s22p63s23p63d104s24p61S0 calculated within the framework of the Hartree–Fock method:20 total electron density (black solid curve); s wavefunctions (other solid curves); p wavefunctions (dashed curves); d wavefunctions (dotted curves). Principal quantum numbers are designated by different colors: K shell (red curve); L shell (blue curves); M shell (green curves); N shell (purple curves).
    Photoionization rates vs radiation temperature for argon (a) and krypton (b) in a Planckian radiation field calculated with different methods: experimental photoionization cross-sections (red solid curves); the present GSPM (solid black curves); the local plasma frequency model using self-consistent Hartree–Fock atomic electron densities (solid yellow curves), Thomas–Fermi atomic densities (solid blue curves), and Lenz–Jensen atomic densities (solid purple curves).
    Fig. 14. Photoionization rates vs radiation temperature for argon (a) and krypton (b) in a Planckian radiation field calculated with different methods: experimental photoionization cross-sections (red solid curves); the present GSPM (solid black curves); the local plasma frequency model using self-consistent Hartree–Fock atomic electron densities (solid yellow curves), Thomas–Fermi atomic densities (solid blue curves), and Lenz–Jensen atomic densities (solid purple curves).
    n0l0P1P2P3P4
    1s4.667 × 10−12.724 × 109.458 × 101.189 × 10
    2s5.711 × 10−26.861 × 10−17.768 × 103.644 × 10−1
    2p8.261 × 10−21.843 × 10−17.340 × 1002.580 × 10−1
    3s1.682 × 10−21.436 × 10−17.356 × 1001.436 × 10−1
    3p2.751 × 10−21.742 × 10−17.162 × 1001.742 × 10−1
    3d3.788 × 10−31.566 × 10−17.880 × 1001.566 × 10−1
    4s7.096 × 10−38.799 × 10−27.308 × 1008.799 × 10−2
    4p1.493 × 10−21.197 × 10−11.027 × 1011.197 × 10−1
    4d1.769 × 10−31.205 × 10−16.346 × 1001.205 × 10−1
    4f1.092 × 10−41.055 × 10−19.231 × 1001.055 × 10−1
    5s3.956 × 10−35.846 × 10−28.651 × 1005.846 × 10−2
    Table 1. Numerical quantum mechanical calculations of the photoionization cross-sections of H-like ions from the n0l0 subshells. For H-like ions, Z̃=Zeff=Zn. Fitting parameters are generally accurate within 20% in the wide energy range from 10−3 < u < 32.
    F. B. Rosmej, L. A. Vainshtein, V. A. Astapenko, V. S. Lisitsa. Statistical and quantum photoionization cross sections in plasmas: Analytical approaches for any configurations including inner shells[J]. Matter and Radiation at Extremes, 2020, 5(6): 064202
    Download Citation