• Laser & Optoelectronics Progress
  • Vol. 60, Issue 7, 0736001 (2023)
Shuo Wang1、2, Fangshu Li1、3, Haocheng Lu1、2, Wenyang Zheng1、2, Xulin Zhao1、4, Yang Jiang1、2, Na Li1、5、*, Ya Bai1、2、**, and Peng Liu1、2
Author Affiliations
  • 1State Key Laboratory of High Field Laser Physics and CAS Center for Excellence in Ultra-Intense Laser Science, Shanghai Institute of Optics and Fine Mechanics, Chinese Academy of Sciences, Shanghai 201800, China
  • 2Center of Materials Science and Optoelectronics Engineering, University of Chinese Academy of Sciences, Beijing 100049, China
  • 3China MOE Key Laboratory of Advanced Micro-Structured Materials, Institute of Precision Optical Engineering, School of Physics Science and Engineering, Tongji University, Shanghai 200092, China
  • 4Department of Physics, Shanghai University, Shanghai 200444, China
  • 5School of Physics and Electronic Engineering, Xinxiang University, Xinxiang 453003, Henan, China
  • show less
    DOI: 10.3788/LOP230448 Cite this Article Set citation alerts
    Shuo Wang, Fangshu Li, Haocheng Lu, Wenyang Zheng, Xulin Zhao, Yang Jiang, Na Li, Ya Bai, Peng Liu. [J]. Laser & Optoelectronics Progress, 2023, 60(7): 0736001 Copy Citation Text show less
    Local THz generated at different positions of medium. THz waveform evolved with position with different φ0 of (a) 0.5π and (b) 0.6π; (c) THz waveforms from different position -3 mm (black curve) and 3 mm (red curve) in Fig. 1(a); (d) THz amplitude taken from Fig. 1(a) (green solid curve) and Fig. 1(b) (blue dash curve) at the time of 0 ps and pulse CEP shown in yellow solid curve (φ0=0.5π) and yellow dash curve (φ0=0.6π); (e) polarity of local THz
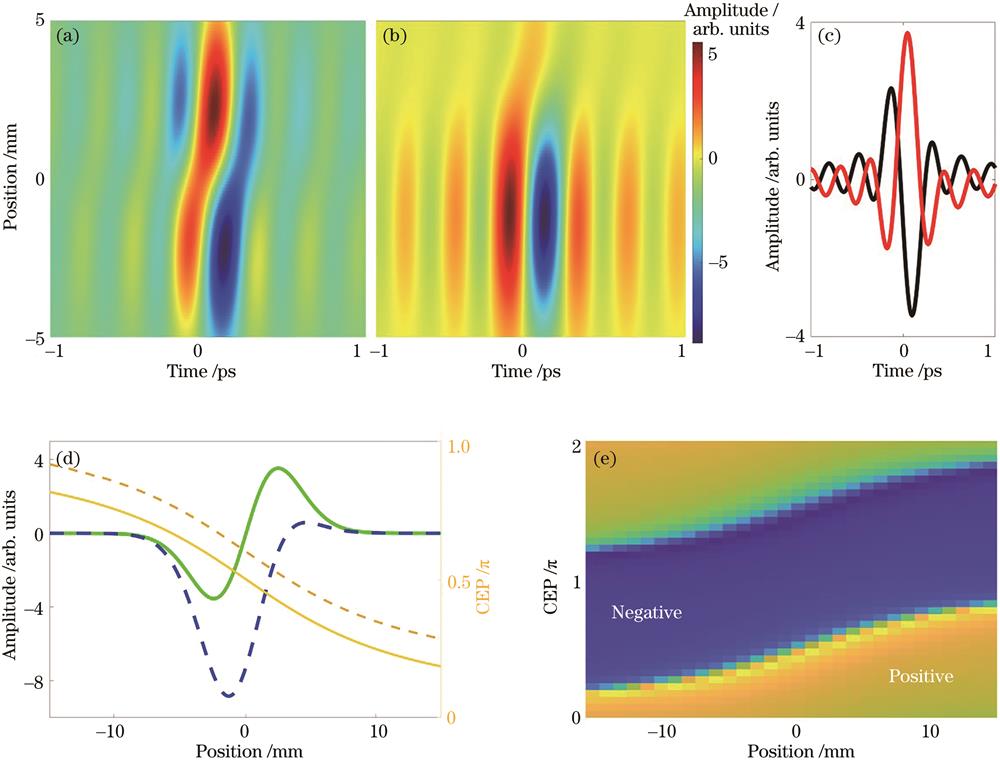
    Fig. 1. Local THz generated at different positions of medium. THz waveform evolved with position with different φ0 of (a) 0.5π and (b) 0.6π; (c) THz waveforms from different position -3 mm (black curve) and 3 mm (red curve) in Fig. 1(a); (d) THz amplitude taken from Fig. 1(a) (green solid curve) and Fig. 1(b) (blue dash curve) at the time of 0 ps and pulse CEP shown in yellow solid curve (φ0=0.5π) and yellow dash curve (φ0=0.6π); (e) polarity of local THz
    Schematic diagram of off-axis phase matching
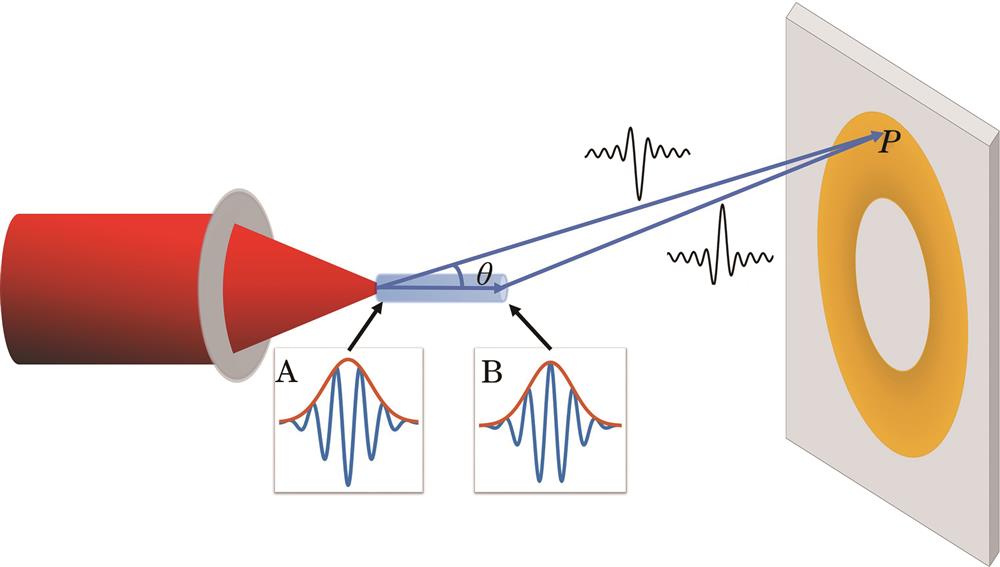
    Fig. 2. Schematic diagram of off-axis phase matching
    THz far-filed intensity distribution (< 3 THz) with different φ0 of (a) 0.5π and (b) 0.6π; different medium length (c) 6 mm and (d) 2 mm
    Fig. 3. THz far-filed intensity distribution (< 3 THz) with different φ0 of (a) 0.5π and (b) 0.6π; different medium length (c) 6 mm and (d) 2 mm
    Phase-matching angle with different THz frequencies
    Fig. 4. Phase-matching angle with different THz frequencies
    Peak-to-valley ratio (< 3 THz) evolved with φ0
    Fig. 5. Peak-to-valley ratio (< 3 THz) evolved with φ0
    Shuo Wang, Fangshu Li, Haocheng Lu, Wenyang Zheng, Xulin Zhao, Yang Jiang, Na Li, Ya Bai, Peng Liu. [J]. Laser & Optoelectronics Progress, 2023, 60(7): 0736001
    Download Citation