1Department of Biomedical Science and Engineering, Institute of Integrated Technology, Gwangju Institute of Science and Technology, Gwangju 61005, Korea
2School of Electrical Engineering and Computer Science, Gwangju Institute of Science and Technology, Gwangju 61005, Korea
3School of Undergraduate Studies, Daegu Gyeongbuk Institute of Science and Technology, Daegu 42988, Korea
Myeongsu Seong, Phuong Minh Mai, Kijoon Lee, Jae Gwan Kim. Simultaneous blood flow and oxygenation measurements using an off-the-shelf spectrometer[J]. Chinese Optics Letters, 2018, 16(7): 071701
Copy Citation Text
Blood oxygenation and flow are both important parameters in a living body. In this Letter, we introduce a simple configuration to simultaneously measure blood flow and oxygenation using an off-the-shelf spectrometer. With the integration time of 10 ms, flow phantom measurements, a liquid blood phantom test, and an arm cuff occlusion paradigm were performed to validate the feasibility of the system. We expect this proof-of-concept study would be widely adopted by other researchers for acquiring both blood flow and oxygenation changes due to its straightforward configuration and the possibility of multimodal measurement.
Blood oxygenation and flow are both critical parameters in a living body. Lack of oxygen supply will cause tissue hypoxia, which, in turn, results in severe damage to the tissue. If there is any problem in blood flow, the tissue will suffer from lack of oxygen and nutrients because of problems in the material exchange between tissue and blood. To monitor the blood flow and oxygenation changes simultaneously, various techniques have been introduced. Among many techniques, optics-based techniques have been extensively investigated due to their good temporal resolution, non-invasiveness, and sensitivity to micro-circulation, which is an indication of appropriate blood supply to vital organs (e.g., brain).
To investigate deep tissue blood flow and oxygenation, a dual-wavelength diffuse correlation spectroscopy (DW-DCS) or DCS flow-oximeter was introduced, validated, and applied to various clinical and preclinical monitoring applications[1–3]. Recently, we introduced and validated dual-wavelength diffuse speckle contrast analysis (DW-DSCA) as an alternative technique to DW-DCS[4].
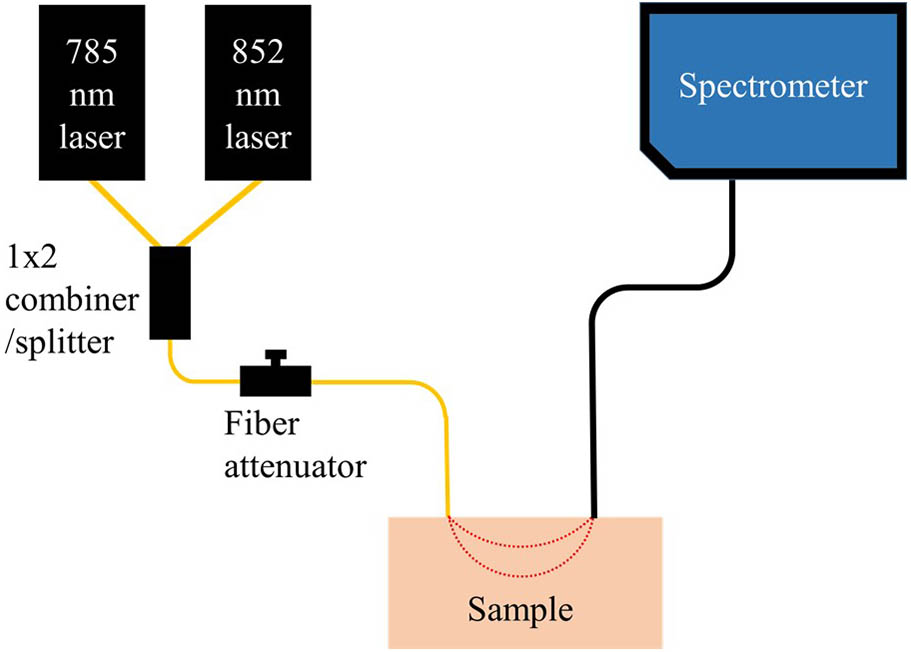
In this proof-of-concept study, we propose an off-the-shelf spectrometer and two lasers based on simultaneous blood flow and oxygenation measurement in deep tissue. The system was validated with the flow and blood phantoms and preliminary in vivo measurement. Compared to the previous research, the use of a spectrometer offers us multiple advantages, including the inherent ability to be expanded to a multimodal spectroscopy (e.g., monitoring of blood flow, hemoglobin concentration, and fluorescence), no synchronization required[4], no hardware modification required[5], and ease for positioning of the fiber-optic probe on the region of interest[4]. Figure 1 shows the schematic of the proposed system.
Sign up for Chinese Optics Letters TOC. Get the latest issue of Chinese Optics Letters delivered right to you!Sign up now
Figure 1.Schematic of the proposed system. The system is configured with two lasers, a combiner/splitter, a fiber attenuator, and an off-the-shelf spectrometer coupled with detection fiber.
An off-the-shelf spectrometer (USB-4000, Ocean Optics) was used in this proof-of-concept study. A 400 μm core sized optical fiber (#58–456, 0.22 N.A., Edmund Optics) was used as a detection fiber. Integration time was set to 10 ms for the spectrometer throughout the measurements. Two long coherence length lasers with 785 and 852 nm wavelengths (CrystaLaser) were utilized as light sources. The lasers were coupled with a combiner [ planar lightwave circuit (PLC) fiber combiner/splitter with 62.5 μm core size, Fiberpia]. The one end of the combiner/splitter was connected to an optical attenuator (BB-500-11-650/850-62.5/125-M-35-3U3U-3-0.5-ND-SP, Oz Optics). By adjusting the optical attenuator, optical powers for 785 and 852 nm were set to 16.67 and 13.34 mW, respectively.
To extract blood flow information, we followed a temporal DSCA that considers as the blood flow index (BFI)[5]. The relationship between speckle contrast , and normalized electric field autocorrelation function has been introduced and proved[5–10]. The relationship is where is the temporal speckle contrast as a function of an integration time, and are the standard deviation (S.D.) and the average of intensity values of a pixel within a unit time, respectively, is a constant related to detector geometry, and is a delay time. Figure 2 shows the graphical procedure of how to get a BFI for each wavelength in a unit time. Practically, we calculated the average and S.D. of intensity values from the selected pixel of the spectrometer for each wavelength for a unit time, here, 1 s. The calculated values were used to get the BFI as described.
Figure 2.Graphical explanation of the procedure to get the blood flow index (BFI) for each wavelength. One square means one pixel. Time varying intensity values for pixels of 785 and 852 nm were used to get the BFI for each wavelength in unit time.
Oxygenated hemoglobin (HbO) and deoxygenated hemoglobin (Hb) were tracked using the so-called modified Beer-Lambert law (MBLL)[1–4,11–14], where and denote concentration changes of Hb and HbO, respectively, denotes a source-detector separation, DPF denotes a differential path length factor that accounts for an extended distance that light travels through a scattering medium, is the extinction coefficient for different hemoglobin at different wavelengths, and is the optical density change at wavelengths. is calculated by the summation of and , which is defined as concentration changes of total hemoglobin. Wavelengths of 785 and 852 nm are considerately selected so that the matrix of extinction coefficients would have its inverse[13]. DPF was set as 1 for both wavelengths, since it is not possible to measure DPF using the suggested configuration. The sampling frequency of the suggested system was 1 Hz. A moving average filter with a window size of 5 was applied to all the data.
To evaluate the sensitivity of the system to subsurface flow change, we performed flow phantom tests. A silicone-based flow phantom ( and at 830 nm) was constructed[4–6]. The depth of the flow was 0.75 cm. A single syringe pump (Harvard Apparatus) flowed 0.6% diluted intravenous fat emulsion (Lipision 20%, JW Pharm.) into the phantom at flow rates from 0 to 0.02 mL/s (0.01 mL/s of increment) and from 0.02 to 0.06 mL/s (0.02 mL/s of increment). Each flow rate was measured for 1 min. Assuming that capillary velocity is approximately 1 mm/s[15], the phantom flow rates cover the physiologically relevant velocities. The same phantom was measured with a lab-built DCS for comparison[16]. Details of the DCS can be found elsewhere[2,3,15–17]. The software correlator generated , which is an unnormalized intensity autocorrelation curve. The curve was normalized as , and was converted to , which is the normalized electric field autocorrelation curve following the Siegert relationship[2,5,6,15–17], where is normalized intensity autocorrelation curve.
The curve of DCS was numerically integrated to get squared speckle contrast following Eq. (1). The squared speckle contrast of DCS was converted to , which is the BFI of temporal DSCA for comparison. was extracted by non-linear fitting of the curve to the non-linear solution of , the unnormalized electric field autocorrelation curve. The sampling frequency of collecting the transistor–transistor logic (TTL) pulse was 2 MHz. In this measurement, half of the TTL pulse train (1 million data) was used to generate one autocorrelation curve, which resulted in 2 Hz of BFI signals.
To test the blood oxygenation measurement of the proposed system, we performed a blood phantom test. Details of the blood phantom test are described elsewhere[13]. Briefly, 2 mL of human blood collected from a healthy subject was added to 285 mL of 1% intravenous fat emulsion (Lipision 20%, JW Pharm.). The solution was thoroughly mixed using a stirrer for 20 min. For the first 10 min of baseline measurement, a mixture of 21% and 79% gases mimicking air was supplied. Following the baseline measurement, we mimicked deoxygenation and re-oxygenation of the blood in the phantom by supplying 100% gas for 45 min and 100% gas for 25 min, respectively. During the measurement, the stirrer continuously mixed the blood phantom with 100 r/min of speed, so that deoxygenation and re-oxygenation of hemoglobin happened thoroughly in the phantom. The probe was submerged in the phantom for maintaining the boundary condition during the measurement. The source-detector separation for the liquid phantom test was set to 1.0 cm because of the size of the container used.
An arterial arm cuff occlusion was performed on a healthy volunteer, measuring blood flow and oxygenation changes using the system to test the applicability of the system to an in vivo situation. During the paradigm, dramatic blood flow and oxygenation changes are induced in a subject’s arm by applying pressure. The distance between the source fiber and detector fiber was 1.0 cm, the fibers were placed on the subject’s right forearm, and the cuff occlusion was performed on the upper arm. The total measurement time was 7 min. For 1 min, baseline signals were measured. For 3 min, signals were measured after cuff inflation with 220 mmHg of pressure on the subject’s upper arm. For the other 3 min, the signals were measured after cuff deflation. The cuff occlusion protocol was reviewed and approved by the Gwangju Institute of Science and Technology’s institutional review board (IRB 20140319-HR-10-01-02). For comparison, we performed separate measurements using a broadband near-infrared spectroscopy (NIRS) setup with bundled fibers (custom fiber-optic cable, Fiber Optic Korea), a broadband light source (HL-2000-HP, Ocean Optics), and the same spectrometer (USB-4000, Ocean Optics) and laser Doppler flowmetry (BLF21, Transonic Systems Inc.) with an analog-to-digital converter (PowreLab/400, AD Instruments). The same MBLL was used to get concentration changes of hemoglobin for the broadband NIRS.
Figure 3 shows the result of the flow phantom test. For each flow rate, the averaged BFI and its S.D. for two wavelengths and DCS were calculated using 40 s of data among 1 min of data due to the initial fluctuation of the signal during flow transition. The error bar indicates for each flow rate.
Figure 3.Variation of normalized BFI of diffuse correlation spectroscopy, DCS (blue square), 785 nm signal (red dot), and 852 nm signal (green down triangle) of the spectrometer measured on the flow phantom while varying flow rate from 0 to 0.02 mL/s (with 0.01 mL/s of increment) and from 0.02 to 0.06 mL/s (with 0.02 mL/s of increment).
All of the normalized BFIs increased with regard to the increment of the flow rate of the flow phantom. Until 0.02 mL/s of flow rate, BFIs of the spectrometer were overlapped while they showed a discrepancy for 0.04 and 0.06 mL/s of flow rates. The discrepancy of the signal between 785 and 852 nm for the spectrometer may come from the difference of optical properties for both wavelengths. Since the difference of optical properties would introduce different probing depths, the light for both wavelengths interacts with different amounts of dynamic scatterers. The discrepancy between the DCS BFI and the spectrometer BFI comes from the difference of detector geometries and total paths that light travels. Compared to BFIs from DCS, BFIs from the spectrometer showed larger S.D. values, which indicate higher fluctuation. The spectrometer BFI has a larger fluctuation than the DCS BFI due to the inherent higher noise level of the spectrometer compared to the one of a single-photon counting module (SPCM-AQRH-12, Excelitas Technologies Inc.).
Figure 4 shows the result of the blood phantom test.
Figure 4.Variation of oxygenated (red square), deoxygenated (blue circle), and total hemoglobin (green up triangle) concentration to test the feasibility of oxygenation measurement of the system by the blood phantom test. 21% and 79% gases mimicking air (air), 100% gas (), and 100% () were sequentially supplied for 10, 45, and 25 min, respectively. When gas was supplied, the phantom was deoxygenated, and it was re-oxygenated when gas was supplied.
For 10 min of baseline (air, 21% and 79% gases supply), no significant change was observed even with a stirring rate at 100 r/min. For 45 min of deoxygenation (, 100% of gas supply) after the baseline measurement, an increase of and a decrease of were shown. The fluctuation in the early deoxygenation stage might come from intensity fluctuation due to gas transition. For 25 min of re-oxygenation (, 100% of gas supply), the and returned to the baseline. The trend of the signal followed other NIRS blood phantom measurements[13]. The phantom showed delayed response in the deoxygenation stage, while the response was quicker in the re-oxygenation stage. The two main factors slowing down the deoxygenation may be lower solubility of nitrogen than the one of oxygen in water[18] and the sigmoidal relationship between partial pressure oxygen and oxygen saturation[19]. The drift of the signal in the initial time of the deoxygenation stage might be due to the gas transition of the gas mixer. Another possibility of the signal drift is temperature variation in the spectrometer that might be overcome with a cooling apparatus. We also observed that BFI values fluctuated continuously but within a certain range, which may be due to the blood mixing using the stirrer (data not shown).
Figure 5 shows the BFI, , and during the arterial arm cuff occlusion paradigm.
Figure 5.Changes of oxygenated (red square for the suggested system and magenta up triangle for broadband NIRS), deoxygenated hemoglobin (blue circle for the suggested system and dark olive diamond for broadband NIRS) concentration (top) and percent variation of blood flow (bottom) for 785 nm (black up triangle with dotted line), 852 nm (red circle with short dashed line), and laser Doppler (blue solid square with solid line) during an arterial arm cuff occlusion (1 min of baseline, 3 min of occlusion with 220 mmHg, and another 3 min after cuff release).
Both hemoglobin concentration and BFI changes showed similar trends as previous studies[2,3]. BFI, , and did not show significant change during baseline measurements except for changes due to cuff inflation for 1 min. Both the proposed system and the broadband NIRS showed a gradual increase of and a decrease of during the cuff occlusion, which returned to the baseline level after reperfusion. The BFI showed a sudden increase and sudden drop at the initial time of the cuff occlusion and maintained the level (approximately 50% drop from the baseline) during the cuff occlusion for all of the blood flow signals. After cuff deflation, and for both techniques returned to the baseline after inversion of the level at the initial time. The BFI returned to its baseline after an overshoot at 785 (reached 216%) and 852 nm (reached 186%) of the suggested system and laser Doppler (reached 211%).
In this Letter, we demonstrated the possibility of simultaneous blood flow and oxygenation measurement based on an off-the-shelf spectrometer and two laser sources. Even though we showed the possibility of the system, this study has some limitations that need to be investigated further. The study used a silicone flow phantom with a circular space that was filled with plastic beads to mimic randomized blood flow. We noticed that such a phantom would have a partial volume effect, which could provide different results when different types of flow phantoms are used[20,21]. Differences of flow phantoms would be a subject of another study. While we followed the temporal DSCA scheme, a multimode fiber (MMF) was used for detection in the study, while the original research used a single mode fiber (SMF)[5]. Since the MMF delivers multiple modes of light, the fluctuation of speckle can be averaged up, resulting the degradation of the flow signal[22]. This averaging effect is a subject for further study, because the averaging would significantly affect the flow measurement.
The proposed configuration has plenty of space for improvement when a better spectrometer with higher quantum efficiency, shorter minimum integration time[5,6,9], and faster data acquisition rate that can allow multiple exposure schemes[8] is employed. There have been many reports using an off-the-shelf spectrometer to measure blood oxygenation in a wide range of fields[11,12,14]. We expect this study will be utilized in other research to extract blood flow information, as well as a further understanding of hemodynamics in a living body due to its simple configuration.
[14] J. Lee, J. G. Kim, S. B. Mahon, D. Mukai, D. Yoon, G. R. Boss, S. E. Patterson, G. Rockwood, G. Isom, M. Brenner. J. Biomed. Opt., 19, 055001(2014).